
- Title
-
Identification of Potentially Related Genes and Mechanisms Involved in Skeletal Muscle Atrophy Induced by Excessive Exercise in Zebrafish
- Authors
- Sun, C.C., Zhou, Z.Q., Chen, Z.L., Zhu, R.K., Yang, D., Peng, X.Y., Zheng, L., Tang, C.F.
- Source
- Full text @ Biology (Basel)
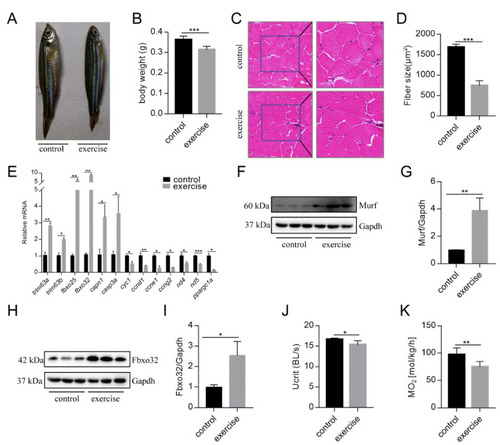
Excessive exercise causes skeletal muscle atrophy in zebrafish. (A) Representative image of excessive exercise and control zebrafish. (B) Changes in the body weight of zebrafish with or without excessive exercise over a 4-week period. (C) Representative photomicrographs of muscle sections stained with H&E. Scale bars = 20 μm. (D) Average fiber size (based on H&E staining). (E) The expression of muscle-atrophy-related genes (trim63a, trim63b, fbxo25, fbxo32, capn1, and casp3a), cyclin (ccnd1, ccne1, and ccng2), mitochondrial function markers (cyc1, nd4, and nd5), and ppargc1a in muscle tissue detected using real-time PCR. (F–I) Western blot analysis of Murf and Fbox32 proteins (representative blot). All uncut western blot images are provided in Supplementary Materials. Data represent mean ± SD (n = 6). (J,K) The critical swimming speed (Ucrit) and oxygen consumption (MO2) were measured using the Loligo System. * p < 0.05, ** p < 0.01, and *** p < 0.001. |
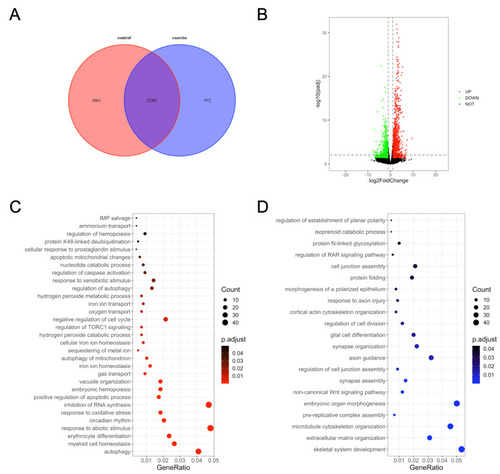
Gene ontology (GO) enrichment analysis of differentially expressed genes in zebrafish skeletal muscles. (A) Venn diagram of the total number of identified genes. (B) Volcano plot constructed using fold change values and Padj value. Red: upregulated, green: downregulated, gray: nonsignificant. (C) GO terms enriched in upregulated genes. (D) GO terms enriched in downregulated genes. |
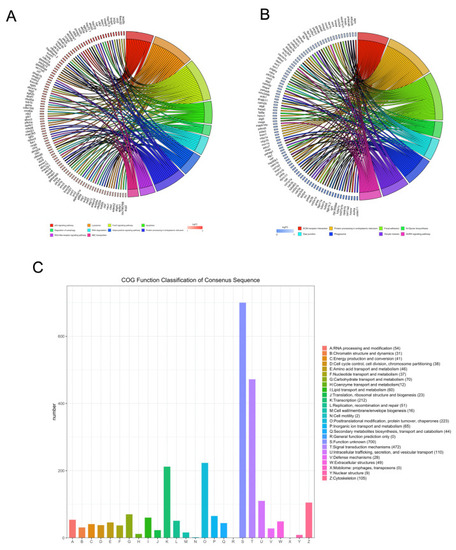
Kyoto encyclopedia of genes and genomes and clusters of orthologous groups (COGs) analysis of DEGs. The David online database and ‘clusterProfiler’ package in R were used to analyze the gene ontology (GO) terms associated with upregulated DEGs (A) and the GO terms associated with downregulated DEGs (B). (C) The BioMart package and COG database were used to obtain the COG assignments of the DEGs. The vertical axis represents the number of DEGs in each category, and the horizontal axis represents the COG functional category. |
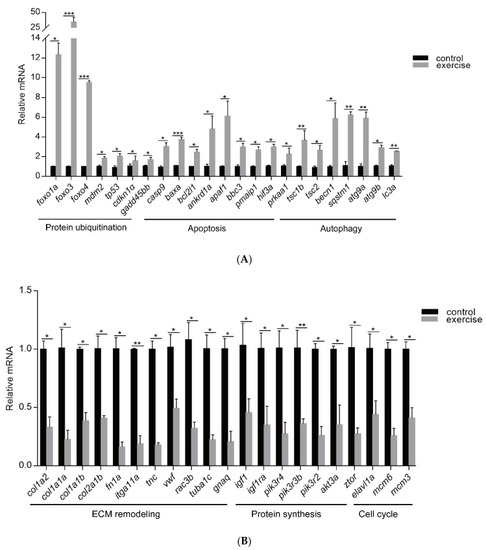
qRT-PCR was used to quantify key genes related to muscle atrophy caused by excessive exercise. (A) Upregulated genes. (B) Downregulated genes. The data represent mean ± SD (n = 6). * p < 0.05, ** p < 0.01, and *** p < 0.001. |

Western blot was used to validate key proteins in signals involved in excessive-exercise-induced muscle atrophy. (A) The expression of proteins in the PI3K–AKT signal (representative blot). (B) The expression of proteins in the apoptosis signal (representative blot). (C) The expression of proteins in the autophagy signal (representative blot). Right panels are quantitative analysis data of the protein expression level by Image J and GraphPad Prism. All uncut Western blot images are provided in Supplementary Materials. Data represent mean ± SD (n = 6). * p < 0.05, ** p < 0.01. |
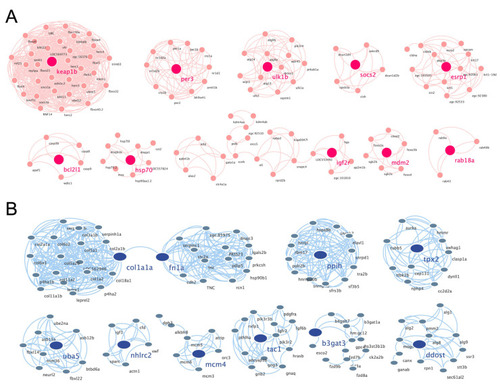
PPI networks of the cluster proteins relating to muscle atrophy caused by excessive exercise. The STRING online database and Cytoscape bioinformatics platform were used to analyze the upregulated (A) and downregulated DEGs (B) (p < 0.05, fold change > 2). |
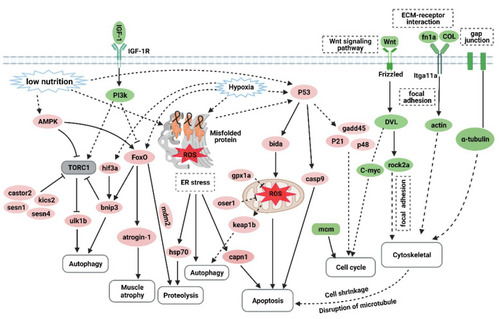
The hypothetical pathogenesis mechanism of muscle atrophy induced by excessive exercise in zebrafish. The upregulated genes are shown in red ovals, and the downregulated genes are shown in green ovals. In response to excessive exercise, the muscle cells may undergo the following events: (1) the inhibition of IGF–PI3K signaling and upregulation of AMPK inhibit the function of the TORC1 complex to suppress protein synthesis and promote autophagy; (2) excessive exercise activates FoxO signaling, which promotes the expression of protein hydrolysis, autophagy, and muscle-atrophy-related gene expression; (3) excessive exercise induces oxidative stress, and the accumulation of misfolded proteins in the endoplasmic reticulum and the activation of p53 signaling lead to proteolysis, autophagy, and apoptosis; (4) overtraining inhibits Wnt signaling and the expression of the MCM complex, which suppresses the proliferation of muscle satellites; and (5) excessive exercise destroys ECM–receptor interaction, focal adhesion, and the gap junction of muscle cells, leading to cytoskeleton damage and inducing apoptosis. (Created with BioRender.com.) |