
FIGURE
Figure 2
- ID
- ZDB-FIG-210902-89
- Publication
- Sun et al., 2021 - Identification of Potentially Related Genes and Mechanisms Involved in Skeletal Muscle Atrophy Induced by Excessive Exercise in Zebrafish
- Other Figures
- All Figure Page
- Back to All Figure Page
Figure 2
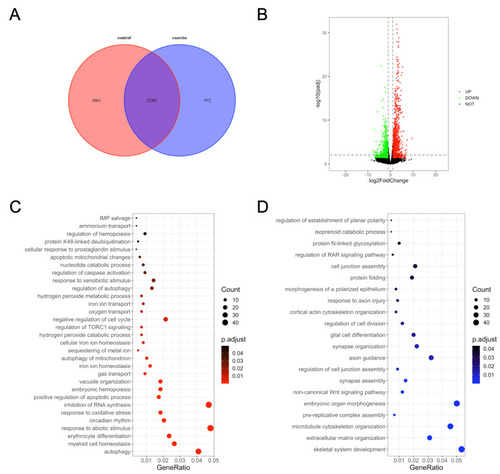
Gene ontology (GO) enrichment analysis of differentially expressed genes in zebrafish skeletal muscles. (A) Venn diagram of the total number of identified genes. (B) Volcano plot constructed using fold change values and Padj value. Red: upregulated, green: downregulated, gray: nonsignificant. (C) GO terms enriched in upregulated genes. (D) GO terms enriched in downregulated genes. |
Expression Data
Expression Detail
Antibody Labeling
Phenotype Data
Phenotype Detail
Acknowledgments
This image is the copyrighted work of the attributed author or publisher, and
ZFIN has permission only to display this image to its users.
Additional permissions should be obtained from the applicable author or publisher of the image.
Full text @ Biology (Basel)