
Image
|
Figure Caption
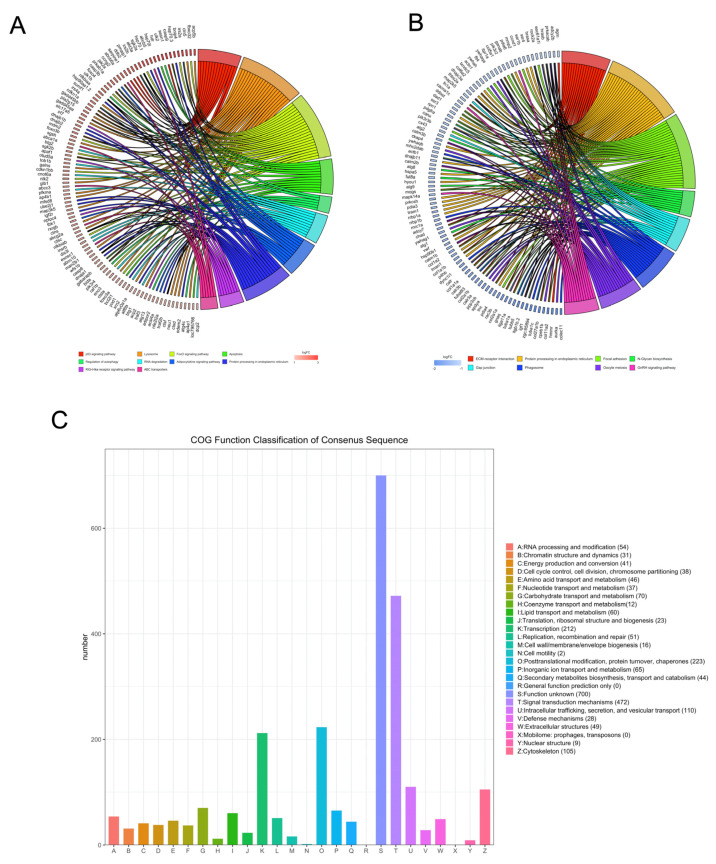
Figure 3
Kyoto encyclopedia of genes and genomes and clusters of orthologous groups (COGs) analysis of DEGs. The David online database and ‘clusterProfiler’ package in R were used to analyze the gene ontology (GO) terms associated with upregulated DEGs (A) and the GO terms associated with downregulated DEGs (B). (C) The BioMart package and COG database were used to obtain the COG assignments of the DEGs. The vertical axis represents the number of DEGs in each category, and the horizontal axis represents the COG functional category.
Acknowledgments
This image is the copyrighted work of the attributed author or publisher, and
ZFIN has permission only to display this image to its users.
Additional permissions should be obtained from the applicable author or publisher of the image.
Full text @ Biology (Basel)