
- Title
-
Dual role of Jam3b in early hematopoietic and vascular development
- Authors
- Kobayashi, I., Kobayashi-Sun, J., Hirakawa, Y., Ouchi, M., Yasuda, K., Kamei, H., Fukuhara, S., Yamaguchi, M.
- Source
- Full text @ Development
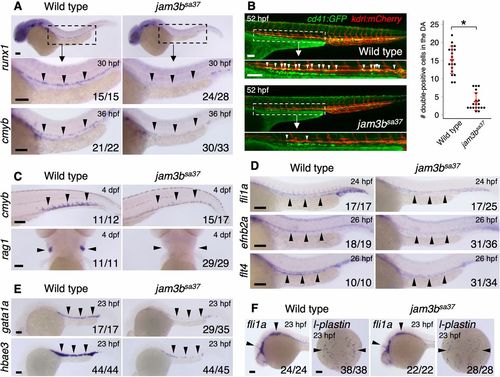
Mutation of jam3b causes defects in both hematopoietic and vascular development. (A) Expression of runx1 and cmyb in the DA of WT or jam3bsa37 embryos. Magnification of boxed area shown underneath. (B) Representative image (left) and quantification (right) of cd41:GFP; kdrl:mCherry double-positive cells in WT or jam3bsa37 embryos. White arrowheads indicate double-positive cells in the ventral floor of the DA. Magnification of boxed area shown underneath. Data are mean±s.d. *P<0.00001 (unpaired two-tailed Student's t-test). (C) Expression of cmyb in the CHT and rag1 in the thymus of WT or jam3bsa37 embryos. (D) Expression of fli1a (endothelium), efnb2a (DA), and flt4 (PCV) in WT or jam3bsa37 embryos. (E) Expression of gata1a and hbae3 in primitive erythrocytes of WT or jam3bsa37 embryos. (F) Expression of fli1a and l-plastin (macrophage) in WT or jam3bsa37 embryos. Black arrowheads indicate the expression domain of each gene. Numbers in bottom right of panels indicate the number of embryos showing the displayed expression pattern over the total number of analyzed embryos. Scale bars: 100 μm. EXPRESSION / LABELING:
PHENOTYPE:
|

Mutation of jam3b reduces npas4l expression in the PLPM. (A) Expression of gata1a, scl, etv2, fli1a and npas4l in the PLPM of WT or jam3bsa37 embryos at 14 hpf. (B) Relative expression levels of npas4l and fli1a in isolated fli1a:GFP (+) cells from WT or jam3bsa37 embryos at 15 hpf. Error bars represent s.d. (n=3 each). (C) Expression of spi1b, scl and etv2 in the ALPM of WT or jam3bsa37 embryos at 14 hpf. (D) Expression of npas4l at 11 hpf (left) and fli1a at 12 hpf (right) in the PLPM of WT or jam3bsa37 embryos. Numbers in bottom right of panels indicate the number of embryos showing the displayed expression pattern over the total number of analyzed embryos. Scale bars: 100 μm. EXPRESSION / LABELING:
PHENOTYPE:
|
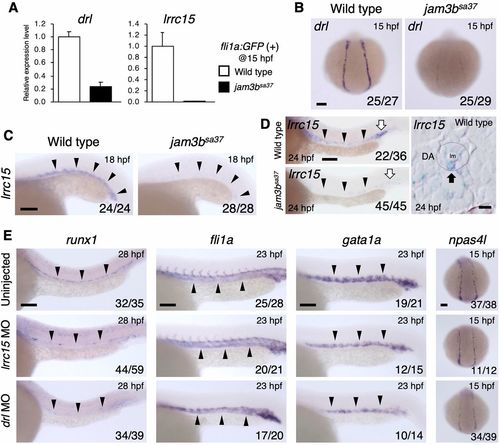
Loss of drl and lrrc15 leads to the defect of hematopoietic and/or vascular development. (A) Relative expression levels of drl and lrrc15 in isolated fli1a:GFP (+) cells from WT or jam3bsa37 embryos. Error bars represent s.d. (n=3 each). (B) Expression of drl in the PLPM of WT or jam3bsa37 embryos. (C,D) Expression of lrrc15 in WT or jam3bsa37 embryos. Black arrowheads indicate the vascular cord (C) or DA (D). White arrows indicate primitive erythrocytes in the PBI (D, left). A dotted circle outlines the DA, and a black arrow indicates an lrrc15-expressing cell in the ventral floor of the DA (D, right). (E) Expression of runx1, fli1a, gata1a and npas4l in embryos uninjected or injected with lrrc15 MO or drl MO. Black arrowheads in E indicate the expression domain of each gene. Numbers in bottom right of panels indicate the number of embryos showing the displayed expression pattern over the total number of analyzed embryos. lm, lumen. Scale bars: 5 μm (D, right panels); 100 μm (B,C,E; D, left panels). EXPRESSION / LABELING:
PHENOTYPE:
|
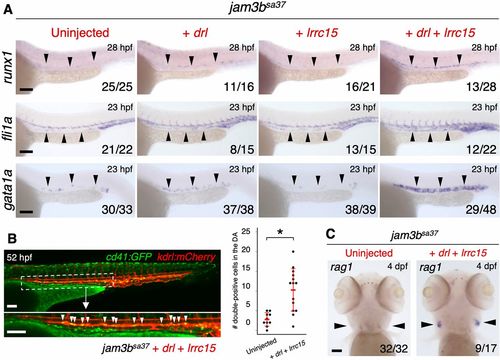
Co-injection of drl and lrrc15 mRNA rescues hemato-vascular development in jam3bsa37 embryos. (A) Expression of runx1, fli1a and gata1a in jam3bsa37 embryos uninjected or injected with drl mRNA, lrrc15 mRNA, or both drl and lrrc15 mRNA. (B) Representative image (left) and quantification (right) of cd41:GFP; kdrl:mCherry double-positive cells in jam3bsa37 embryos uninjected or co-injected with drl and lrrc15 mRNA. White arrowheads indicate double-positive cells in the ventral floor of the DA in jam3bsa37 embryos injected with both drl and lrrc15 mRNA. Magnification of boxed area shown underneath. Data are mean±s.d. *P<0.001 (unpaired two-tailed Student's t-test). (C) Expression of rag1 in the thymus in jam3bsa37 embryos uninjected or co-injected with drl and lrrc15 mRNA. Percent distribution of runx1 expression in A is shown in Fig. S8A. Black arrowheads indicate the expression domain of each gene. Numbers in bottom right of panels indicate the number of embryos showing the displayed expression pattern over the total number of analyzed embryos. Scale bars: 100 μm. EXPRESSION / LABELING:
PHENOTYPE:
|
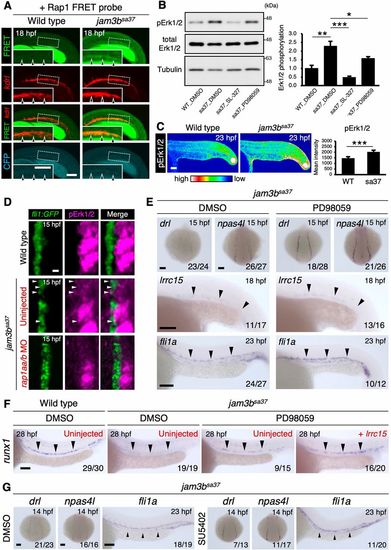
Jam3b suppresses Rap1a-Erk activity to promote hemato-vascular development. (A) Confocal imaging of FRET signals under the kdrl:mCherry background. WT and jam3bsa37 embryos injected with Raichu-Rap1 mRNA are shown. Insets show a high magnification view of the dotted boxed area. Arrowheads indicate the kdrl:mCherry (+) vascular cord. Data are representative of eight embryos for each genotype. (B) Western blotting analysis (left) of phosphorylated Erk1/2 (pErk1/2), total Erk1/2 and Tubulin at 23 hpf in WT embryos treated with DMSO and jam3bsa37 embryos treated with DMSO, SL-327 or PD98059. The graph (right) denotes the ratio of pErk1/2 to total Erk1/2 in each embryo. Error bars represent s.d. (n=3 each). (C) Immunostaining of pErk1/2 in WT or jam3bsa37 embryos at 23 hpf (left). The graph (right) denotes the mean intensity of pErk1/2 in WT and jam3bsa37 embryos. Error bars represent s.d. (n=8 each). (D) Immunostaining of pErk1/2 in WT or jam3bsa37 embryos uninjected or co-injected with rap1aa and rap1ab MO (rap1aa/b MO). PLPM cells labeled with fli1a:GFP at 15 hpf are shown. White arrowheads indicate pErk1/2 (+) fli1a:GFP (+) cells. (E) Expression of drl, npas4l, lrrc15 and fli1a in jam3bsa37 embryos treated with DMSO (left) or PD98059 (right). (F) Expression of runx1 in the DA in WT embryos treated with DMSO (left) or in jam3bsa37 embryos treated with DMSO, or PD98059, uninjected or injected with lrrc15 mRNA (right). (G) Expression of drl, npas4l and fli1a in jam3bsa37 embryos treated with DMSO (left) or SU5402 (right). Percent distribution of runx1 expression in F is shown in Fig. S8B. Black arrowheads in E-G indicate the expression domain of each gene. *P<0.05, **P<0.01, ***P<0.001 (unpaired two-tailed Student's t-test). Numbers in bottom right of panels indicate the number of embryos showing the displayed expression pattern over the total number of analyzed embryos. Scale bars: 100 μm. EXPRESSION / LABELING:
PHENOTYPE:
|
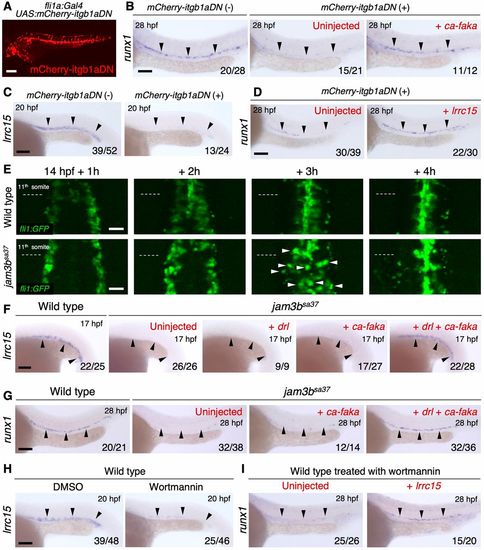
Jam3b regulates the integrin signaling pathway to form HSCs. (A) Fluorescent image of a fli1a:Gal4; UAS:mCherry-itgb1aDN embryo. (B) Expression of runx1 in the DA of mCherry-itgb1aDN (−), or mCherry-itgb1aDN (+) embryos uninjected or injected with ca-faka mRNA. (C) Expression of lrrc15 in the vascular cord of mCherry-itgb1aDN (−) or mCherry-itgb1aDN (+) embryos. (D) Expression of runx1 in the DA of mCherry-itgb1aDN (+) embryos uninjected or injected with lrrc15 mRNA. (E) Time-lapse images of fli1a:GFP in WT or jam3bsa37 embryos. Dotted lines indicate the boundary of eleventh and twelfth somite at each time point. White arrowheads indicate a subset of fli1a:GFP (+) cells that show a rounded morphology. Data are representative of four embryos for each genotype. (F) Expression of lrrc15 in the vascular cord of WT, or jam3bsa37 embryos uninjected or injected with drl mRNA, ca-faka mRNA, or both drl and ca-faka mRNA. (G) Expression of runx1 in the DA of WT, or jam3bsa37 embryos uninjected or injected with ca-faka mRNA or both drl and ca-faka mRNA. (H) Expression of lrrc15 in the vascular cord of WT embryos treated with DMSO or wortmannin. (I) Expression of runx1 in the DA of WT embryos treated with wortmannin, either uninjected or injected with lrrc15 mRNA. Percent distribution of runx1 expression in I is shown in Fig. S8C. Black arrowheads indicate the expression domain of each gene. Numbers in bottom right of panels indicate the number of embryos showing the displayed expression pattern over the total number of analyzed embryos. Scale bars: 50 μm (E); 100 μm (A-D,F-H). EXPRESSION / LABELING:
PHENOTYPE:
|

ZFIN is incorporating published figure images and captions as part of an ongoing project. Figures from some publications have not yet been curated, or are not available for display because of copyright restrictions. |
|
ZFIN is incorporating published figure images and captions as part of an ongoing project. Figures from some publications have not yet been curated, or are not available for display because of copyright restrictions. EXPRESSION / LABELING:
PHENOTYPE:
|
|
ZFIN is incorporating published figure images and captions as part of an ongoing project. Figures from some publications have not yet been curated, or are not available for display because of copyright restrictions. EXPRESSION / LABELING:
PHENOTYPE:
|
|
ZFIN is incorporating published figure images and captions as part of an ongoing project. Figures from some publications have not yet been curated, or are not available for display because of copyright restrictions. EXPRESSION / LABELING:
PHENOTYPE:
|
|
ZFIN is incorporating published figure images and captions as part of an ongoing project. Figures from some publications have not yet been curated, or are not available for display because of copyright restrictions. EXPRESSION / LABELING:
PHENOTYPE:
|