
- Title
-
Strategy of Hepatic Metabolic Defects Induced by beclin1 Heterozygosity in Adult Zebrafish
- Authors
- Mawed, S.A., He, Y., Zhang, J., Mei, J.
- Source
- Full text @ Int. J. Mol. Sci.
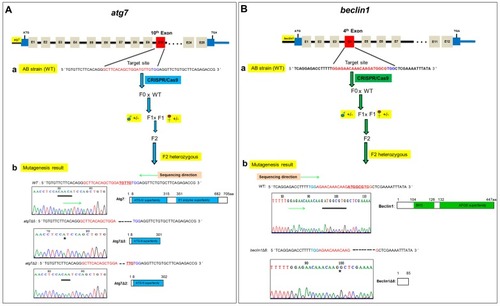
Generation of |
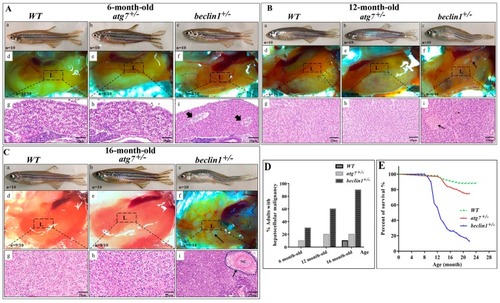
PHENOTYPE:
|
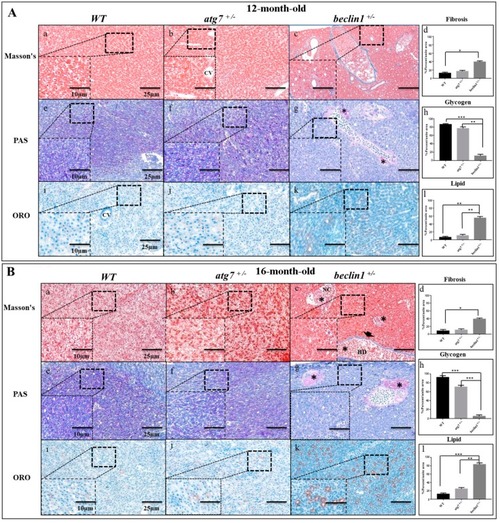
Defects of hepatic energy metabolism in male PHENOTYPE:
|
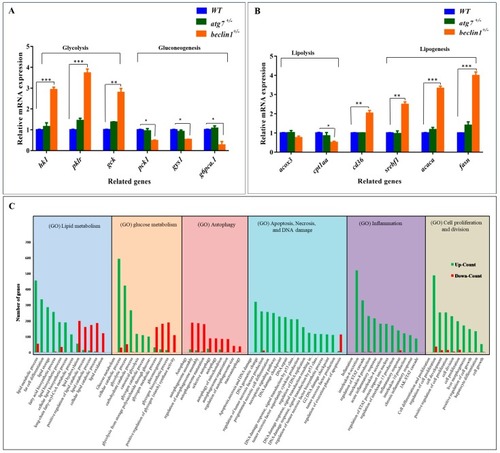
Effects of |
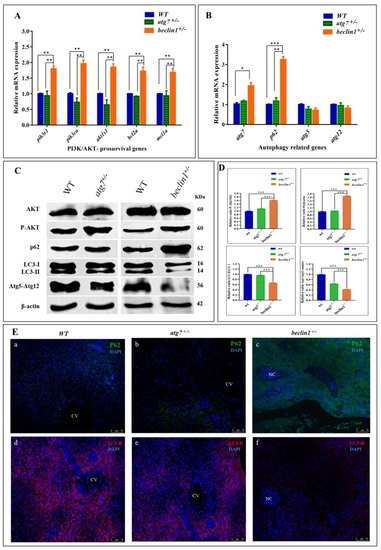
Dysregulated phosphoinositide-3-kinase (PI3K), the serine-threonine protein kinase (AKT) and autophagy pathways in the liver of |
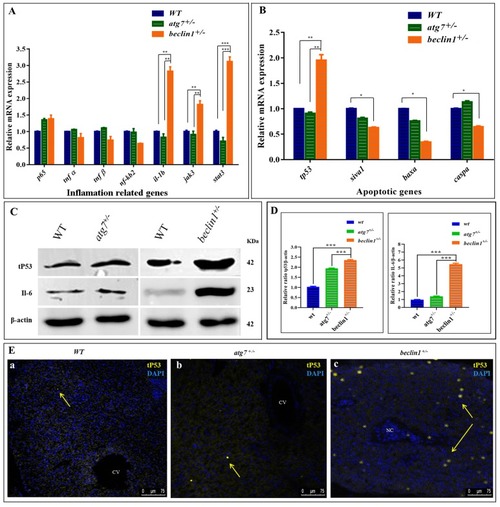
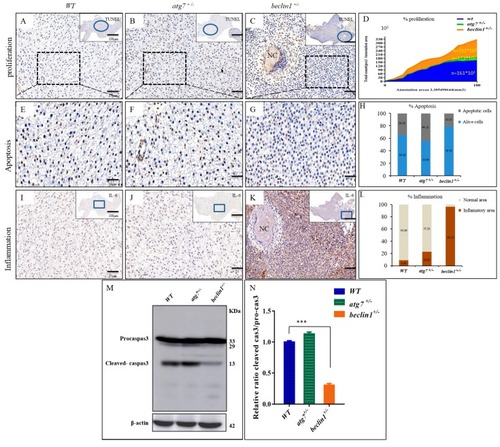
Abnormal apoptosis and inflammation response in |
|

Unillustrated author statements PHENOTYPE:
|