IMAGE

Figure 3

ID
ZDB-IMAGE-200325-74
Source
Figures for Mawed et al., 2020
Image
Figure Caption

Figure 3

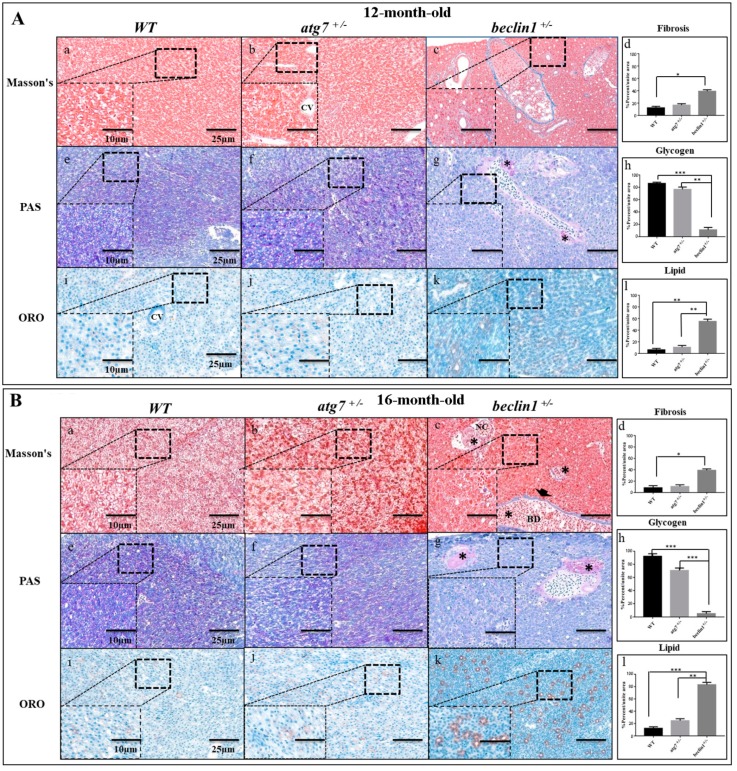
Defects of hepatic energy metabolism in male Beclin1+/− zebrafish. (A) Histological assessment of hepatocytes in 12-month-old male zebrafish. (ad) Representative photomicrographs of Masson’s trichrome staining and the quantification of fibrosis. (eh) Representative photomicrographs of Periodic Acid-Schiff (PAS) staining and glycogen content showing that glycogen packed in the hepatocytes of wild type (WT) and atg7+/− and lacked in beclin1+/− zebrafish; notice the beginning of hepatocellular malignancy (black star) around bile ducts. (il) Oil Red O (ORO) staining and lipid quantification revealing the alternations in fat droplet formation in beclin1+/− hepatocytes. (B) Histological assessment of hepatocytes in 16-month-old male zebrafish. (ad) Representative photomicrographs Masson’s trichrome staining and fibrosis quantification with few fibrils lining the bile duct (arrowhead) and tumor-like cells (black stars) in beclin1+/−. (eh) Representative photomicrographs of PAS staining with sufficient glycogen in WT and atg7+/− and sever glycogen reduction in beclin1+/−, notice the necrotic development around bile ducts (black stars). (il) ORO stain and lipid quantification showing hepatocytes hypertrophy with lipid accumulation and fatty clouds in beclin1+/− zebrafish. Scale magnification is shown in pictures and data are expressed as mean ± SD. * p < 0.05, ** p < 0.01, and *** p < 0.001. CV: Central Vein; BD: Bile Duct; NC: Necrosis.

Figure Data
Acknowledgments
This image is the copyrighted work of the attributed author or publisher, and ZFIN has permission only to display this image to its users. Additional permissions should be obtained from the applicable author or publisher of the image. Full text @ Int. J. Mol. Sci.