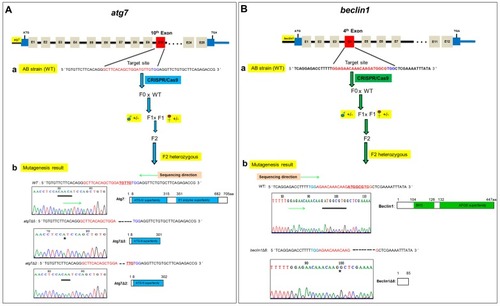
Generation of atg7 and beclin1 zebrafish mutants. (A) The procedure of atg7 targeted mutagenesis. (a) Schematic representation of the zebrafish atg7 target site and generation mating between atg7 F1 heterozygous male (blue circle) and female (red circle) to produce F2 generation. The thin line and grey boxes represent the introns and exons, respectively, and the red box represents the target 10th exon. The sgRNA target sequence is shown in red, followed by a PAM sequence “TGG” shown in blue. (b) Genotyping and illustration of the deduced protein structure of wild-type atg7 and two mutated atg7. The black bar indicates the target sequence of a atg7 wild type (n = 5 bp) in the target site and the black star refers to the deletion part in mutants. (B) The procedure of beclin1 targeted mutagenesis. (a) Schematic representation of the zebrafish beclin1 target site and generation mating between beclin1 F1 heterozygous male (blue circle) and female (red circle) to produce F2 generation. The red box represents the target 4th exon. The sgRNA target sequence is shown in red, followed by a PAM sequence “TGG” shown in blue. (b) Genotyping and illustration of the deduced protein structure of wild-type beclin1 and the mutated beclin1. The black bar indicates the target sequence of a beclin1 wild type (n = 8 bp) in the target site and the black star refers to the deletion part in mutants.
|
