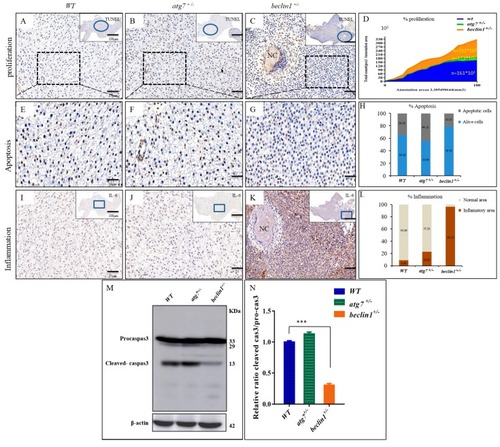
Beclin1 heterozygosity induces cellular proliferation in the hepatic tissue with lower apoptosis and a higher risk of inflammation. (A–C) In situ detection of apoptotic cells by TUNEL staining by higher magnification of the blue circles. Brown apoptotic cells around necrosis (black arrow) are shown. (D) The mean cell number per unit area was quantified by NIH Image J. The results were normalized from three independent slides of the same area. (E–G) Magnified views of the boxed regions in (A–C). (H) Percentage of apoptotic cells according to E-G. The data are shown as the statistical results of three independent experiments, three fields scored per condition. (I–K) Immunohistochemistry assay of liver tissues blocked against IL-6 showed in higher magnification of the blue frames. (L) The signals in (I–K) were scanned with a Pannoramic MIDI scanner to perform image quantification and analysis. Results were summarized from three independent replicates and data were expressed by mean. (M–N) Western blot analysis and quantified protein expression showed that cleaved-caspase3 were downregulated in the beclin1+/− livers in comparison with the WT or atg7+/−. β-actin was used as an internal control. NC: Necrosis. * p < 0.05, ** p < 0.01, and *** < 0.001.
|
