
- Title
-
Stepwise crosstalk between aberrant Nf1, Tp53 and Rb signalling pathways induces gliomagenesis in zebrafish
- Authors
- Luo, J., Liu, P., Lu, C., Bian, W., Su, D., Zhu, C., Xie, S., Pan, Y., Li, N., Cui, W., Pei, D.S., Yang, X.
- Source
- Full text @ Brain

CRISPR/Cas9-based deletion system in zebrafish. (A) Schematic illustration of the constructs of the CRISPR/Cas9-based vector, including the gfap promoter-driving Cas9, mCherry reporter, and U6-driving specific gRNA. (B) Strategy of the generation of the transgenic zebrafish lines. (C) F1 transgenic fish generated by mosaic mCherry-positive fish outcrossed with wild-type fish. A subset of the transgenic offspring was identified by mCherry-positive astrocytes. Scale bar = 1 mm. (D) The colocalization of mCherry-labelled Cas9 and GFP-labelled endogenous Gfap in 60 hpf offspring from the cross of gfapWT and Tg(gfap:GFP) transgenic fish. Scale bars = 500 μm. (E–J) Co-localization of mCherry fluorescent signals (red) and endogenous Gfap detected by anti-Gfap antibody (FITC; green) in the brain and retina (E–G) or spinal cord (H–J) tissue. Scale bars = 200 μm. (K) Representative images of whole-mount in situ hybridization using an anti-sense RNA probe against Cas9 mRNA in 48 hpf embryos injected with Tol2 mRNA and gfap:Cas9-T2A-mCherry,U6:gRNA(null) vector expressing Cas9 under the control of the gfap promoter. Cas9 expression pattern is governed by the tissue-specificity of gfap promoter (yellow arrowheads). Scale bars = 500 μm. |

Disruption of tissue-specific genes in larvae and adult zebrafish. (A) Representative images of various single-deletion mutations, and gfapWT control in 3-month-old adult fish. The fluorescent radial glia phenotype was observed based on mCherry-labelled Gfap expression, which failed to co-localize with Nf1, Rb1 or Tp53 expression in brain tissues of transgenic zebrafish (arrowheads; right), whereas partial co-localizations of mCherry-labelled Gfap with Nf1, Rb1 or Tp53 expression were observed in gfapWT fish (arrows; left). Scale bars = 50 μm. (B) Merged bright and fluorescent images showing mCherry-labelled Gfap expression in the cerebellum and medulla in 3-month-old gfapWT fish. Scale bars = 500 μm. (C) Coronal sections of the images shown in i–iii. Robust mCherry-labelled Gfap expression was observed along the midline and dorsal lining of the fourth ventricle. Scale bars = 50 μm. |
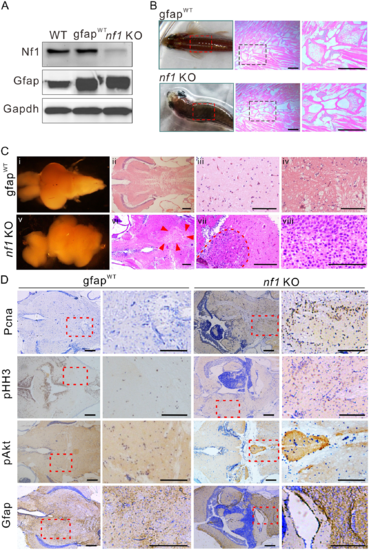
Nf1 mutagenesis in radial glia disrupts the brain architecture and initiates gliomagenesis. (A) Western blot determination of Nf1 and Gfap in brain tissues from wild-type, gfapWT, and nf1 KO fish (n = 3). (B) Typical ‘bending-body’ phenotype and haematoxylin and eosin staining of spinal cord tissue in 2-month-old transgenic zebrafish. Scale bars = 50 μm. (C) The architectures and histology of brain tissues from 3-month-old gfapWT and nf1 KO fish. Brain architecture of 3-month-old gfapWT (i) and nf1 KO fish (v). (ii–iv) Haematoxylin and eosin staining of the cerebellum of gfapWT fish. (vi–viii) The tumours that formed throughout the cerebellum (at different magnifications, the boundaries were indicated by arrowheads or broken line). Scale bars = 100 μm. (D) Immunohistochemistry staining (left) and higher magnifications (right) of Pcna, pHH3, pAkt, and Gfap in brain tissues of 3-month-old gfapWT and nf1 KO fish. Scale bars = 100 μm. Data shown as mean ± SEM. **P < 0.01, ***P < 0.001. EXPRESSION / LABELING:
PHENOTYPE:
|
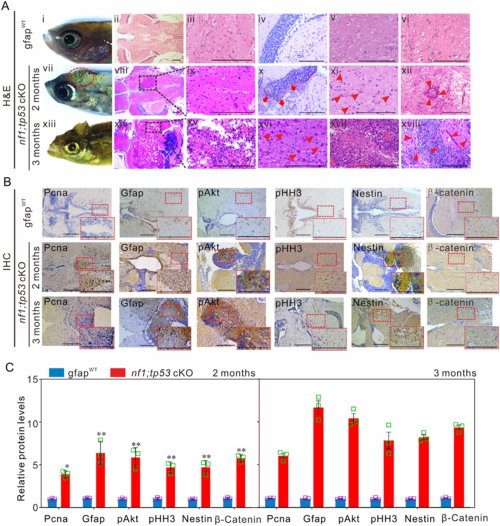
Tp53 mutation promotes the development of gliomagenesis in zebrafish. (A) Histological examinations of 2-month-old gfapWT and nf1;tp53 cKO fish, and 3-month-old nf1;tp53 cKO fish. (i, vii and xiii) Representative images of the bumps on the heads of nf1;tp53 cKO fish. (ii–vi) Representative images of haematoxylin and eosin (H&E) staining of normal brain tissues of gfapWT fish. Several typical gliomagenic phenotypes, including glioblastoma multiforme (viii and ix), increased numbers of multinucleated glial cells (arrowheads; xi and xvi), necrosis (xiv and xv), frequent vascularity (arrowheads; xii and xviii), enhanced invasive capability (red broken line; x), and the typical gliomatosis phenotype (xvii), were detected in 2- and 3-month-old nf1;tp53 cKO fish. (B) Immunohistochemistry staining was performed to examine the expression of tumour-relevant factors in brain tissues of 2-month-old gfapWT, nf1;tp53 cKO, and 3-month-old nf1;tp53 cKO fish. (C) Quantification of immunohistochemistry staining evaluated the expression of Pcna, Gfap, pAkt, pHH3, Nestin, and β-catenin in 2- or 3-month-old gfapWT and nf1;tp53 cKO fish (n = 3 for each group). Scale bars = 100 μm. Data shown as mean ± SEM. *P < 0.05, **P < 0.01, ***P < 0.001. EXPRESSION / LABELING:
PHENOTYPE:
|
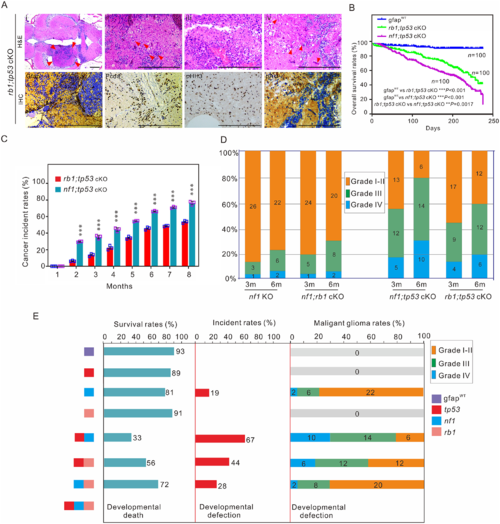
Tp53 mutation is critical for poor prognosis in zebrafish. (A) Histological examination of gliomas in 3-month-old rb1;tp53 cKO fish. (i–iv) Haematoxylin and eosin (H&E) staining showed the generated tumours (arrowheads; i), multinucleated giant cells (arrowheads; ii), the typical gliomatosis phenotype (iii), and vascularity (arrowheads; iv). Immunohistochemistry staining was performed to examine tumour-relevant indicators, including Gfap, Pcna, pHH3, and pAkt, in brain tissues of rb1;tp53 cKO fish. Scale bars = 100 μm. (B and C) Overall survival rates and cancer incidences of rb1;tp53 cKO and nf1;tp53 cKO fish, respectively (n = 100 for each group). The glioma formation was preliminarily estimated based on the ‘bending-body’ phenotype, and confirmed by haematoxylin and eosin staining. (D) Malignancy of the tumours derived from the fish with various mutations at 3 or 6 months of age (n = 30 for each group). (E) Summary of the survival rates, cancer incidences, and malignancy of the generated gliomas in fish lines with various mutations at 6 months of age. Data shown as mean ± SEM. ***P < 0.001. |

Identification of downstream signalling pathways in tumours generated in zebrafish with various mutations. (A) Heat map of differential expression genes based on the ratios identified the fold-changes indicating gains (red) and losses (blue) in the randomly selected brain tissues with glioma formation derived from 3-month-old nf1 cKO (white bar), rb1;tp53 cKO (grey bar), and nf1;tp53 cKO (black bar) fish (n = 3 for each group). The amplifications of genes encoding RTKs Egfr (pink bars) and Pdgfra (green bars), as well as the amplification of cell cycle-related genes (Supplementary Table 6, orange bars) were also indicated. (B) KEGG pathway enrichment analyses of the tumours generated in nf1;tp53 cKO fish. (C) Western blot determinations were performed to confirm the expression of the key gliomagenesis-related factors in gfapWT (lanes 1–2) and nf1;tp53 cKO tumours (lanes 3–6). (D) Relative expression of key factors of RTK/Ras/PI3K, cell cycle, and focal adhesion pathways in nf1 KO, rb1;tp53 cKO and nf1;tp53 cKO fish, compared with gfapWT control (n = 3 for each group). (E and F) Gliomas associated with nf1 and tp53 mutations showed stronger expression of Snail1a (E) and cyclin D1 (F), particularly in the hypercellular area (arrowheads). Scale bars = 100 μm. (G and H) Network visualization of GO terms associated with the downregulated (G) and upregulated genes (H) in brain tissues between nf1;tp53 cKO and gfapWT control. |
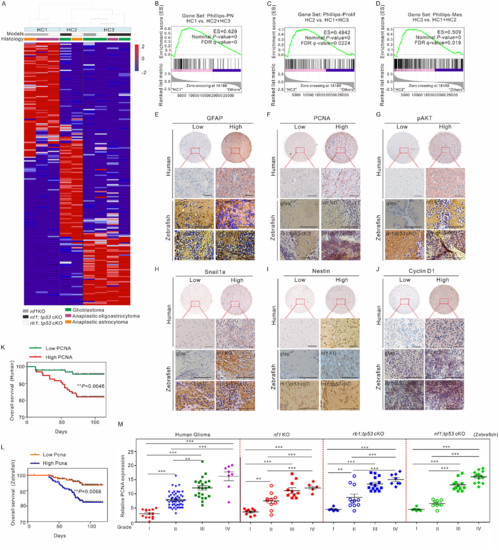
Molecular, histological, and prognostic comparison between zebrafish and human gliomas. (A) The global transcriptome of gliomas generated in nf1 KO (grey bars), nf1;tp53 cKO (black bars), and rb1;tp53 cKO (white bars) fish were analysed by unsupervised hierarchical clustering (HC). The results showed the differential expression levels based on the median absolute deviation scores. Three primary clusters, HC1–3, and their dendrograms were shown at the top of the image. The heat map illustrated the most upregulated probe sets in each cluster derived using a linear model algorithm. The primary histological features were indicated with glioblastoma (green bars), anaplastic oligoastrocytoma (purple bars), and anaplastic astrocytoma (orange bars). (B–D) GSEA enrichment plots were drawn to compare each primary cluster with the other two clusters using three gene sets that define the expression subgroups of human gliomas, namely, Phillips-PN (proneural; B), Phillips-Prolif (proliferative; C), and Phillips-Mes (mesenchymal; D) subgroups. (E–J) Representative images obtained from the histological examination of the expression of several key gliomagenesis-relevant factors, including GFAP, PCNA, pAKT, Snail1a, Nestin, and Cyclin D1, in gliomas formed in human and zebrafish with different mutations (gfapWT, nf1 KO, rb1;tp53 cKO, and nf1;tp53 cKO fish). Scale bars = 100 μm. (K and L) Correlation between prognoses and Pcna expression in brain harboured tumours in humans (n = 97; K) and nf1 KO fish (n = 100; L). (M) Correlation between glioma malignancy (grades I to IV) and PCNA expression in humans (n = 97), nf1 KO (n = 34), rb1;tp53 cKO (n = 40), and nf1;tp53 cKO fish (n = 39). Data shown as mean ± SEM. **P < 0.01, ***P < 0.001. |

Temozolomide treatment inhibits gliomagenesis in nf1 KO and nf1;tp53 cKO fish until 3 months of age. (A) Mortality analyses of nf1 KO and nf1;tp53 cKO fish with or without TMZ treatment (n = 100 for each group; two groups for each line). (B) Tumour incidences were significantly suppressed by TMZ treatment in nf1 KO and nf1;tp53 cKO fish at 3 months of age (n = 100 for each group; two groups for each line). (C) Representative immunohistochemistry images examining the expression of Pcna, pHH3, Gfap, Nestin, Cyclin D1, and pAkt in nf1 KO and nf1;tp53 cKO fish with or without TMZ treatment. Scale bars = 100 μm. (D) Quantification of the percentages of Pcna-positive cells in nf1 KO and nf1;tp53 cKO fish with or without TMZ treatment (n = 5 random fields of view). Data shown as mean ± SEM. *P < 0.05. |

ZFIN is incorporating published figure images and captions as part of an ongoing project. Figures from some publications have not yet been curated, or are not available for display because of copyright restrictions. |