
- Title
-
An early requirement for maternal FoxH1 during zebrafish gastrulation
- Authors
- Pei, W., Noushmehr, H., Costa, J., Ouspenskaia, M.V., Elkahloun, A.G., and Feldman, B.
- Source
- Full text @ Dev. Biol.
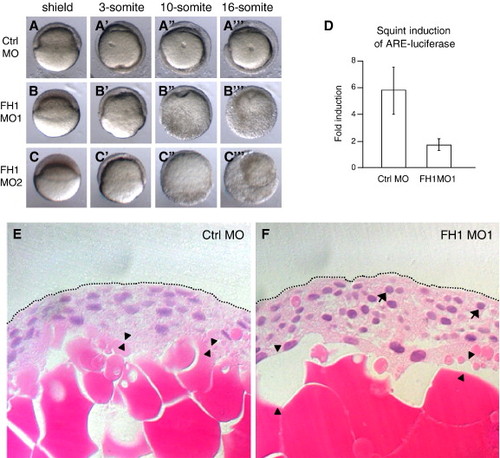
FoxH1 depletion phenotype. (A–C) Two independent FoxH1 MOs produce similar phenotypes. 8 ng of the indicated MO was injected into wild type embryos whose chorions were removed before being mounted in soft agar/agarose and simultaneously time lapse documented, using a lateral view. Dorsal is to the right in panel A, and unknown in panels B, C. Primes (2) indicate different time points for the same embryos. (D) FoxH1 MO1-injected embryos show reduced FoxH1 activity in response to Squint. Wild type embryos were injected with 10 pg of squint mRNA and 25 pg of reporter plasmids, plus 8 ng of either control (Ctrl) MO or FoxH1 (FH1) MO1. Injected embryos were incubated to the dome stage and then lysed for the luciferase assay. (E–F) Histology of a FoxH1 morphant.Wild type embryos were injected with 8 ng of either control or FoxH1 morpholino, fixed at 8 hpf when control embryos were at the 70% epiboly stage and paraffin mounted prior to sectioning and hematoxylin and eosin staining. Arrowheads point to gaps between the yolk and embryonic cells that are plentiful in morphants. (F). Arrows point to rounded nuclei that are abundant in morphant (F), but not control (E) embryos. Abbreviations: FH1, FoxH1; ctrl, control. PHENOTYPE:
|
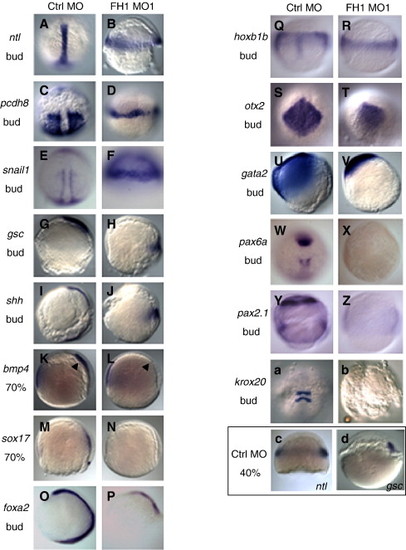
Molecular marker expression in FoxH1-depleted embryos. Wild type embryos were injected with 8 ng of either control MO or FoxH1 MO1, fixed at the indicated stage and processed for whole-mount in situ hybridization. Probes, stages and MOs injected are as indicated. (A–J) Heterochronic expression patterns of mesoderm markers. Panels A–F are dorsal views, with the animal pole to the top; panels G–P are lateral views, with the dorsal side to the right. (K–P) Reduction of mesoderm and endoderm markers. Panels K–P are lateral views, with the dorsal side to the right. (Q–V) Persistence of broad neurectoderm markers in FoxH1 morphants. Panels Q, R are dorsal views, with the animal pole to the top; panels S, T are dorsal-animal views, with the animal pole somewhat below the top; panels U, V are lateral views, with the dorsal side to the right. (W–b) Disrupted neural patterning in FoxH1 morphants. Panels W–Z and a–b are dorsal views, with the animal pole to the top. (c–d) Expression of ntl and gsc in control embryos at the 40% epiboly stage. Panels c, d are lateral views, with the dorsal side to the right. Abbreviations and stages: bud, bud stage (10 hpf); 70%, 70% epiboly stage (8 hpf); 40%, 40% epiboly stage (5 hpf); FH1, FoxH1; ctrl, control. |
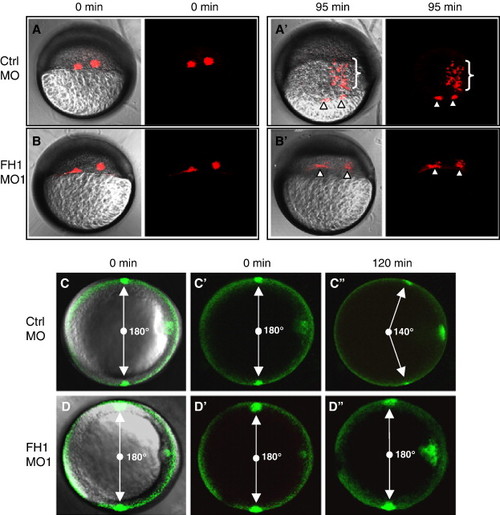
FoxH1-depletion disrupts gastrulation movements. (A, B) FoxH1-depletion disrupts internalization of mesendoderm. Kaede protein was co-injected with 8 ng of the indicated MOs into wild type embryos. Cell labeling was performed by photoactivation of Kaede at 5 hpf (40% epiboly stage). Pictures were taken directly after labeling and 95 min later using lateral views. Primes (′) indicate different time points for the same embryos and bright field (left-hand panel) and fluorescent (right-hand panel) images are shown for each time point. Arrowheads point to the labeled cells remaining at the margin. Brackets in panel A2 indicate labeled cells in control embryos that internalize and migrate towards the animal pole. (C, D) FoxH1-depletion affects convergence.PA-GFP protein was co-injected with 8 ng of the indicated MOs into goosecoid-GFP embryos. Photolabeling of two groups of lateral cells was performed at shield stage using transgenic gsc-GFP as a reference point. Pictures were taken directly after labeling and 120 min later using animal pole views, with dorsal to the right. The angle between the labeled groups is indicated. Primes (2) indicate different time points for the same embryos and panels C and D are composite bright field/fluorescent views, whereas panels, C′, C″, D′ and D''' show the fluorescent channel alone. Abbreviations: FH1, FoxH1; ctrl, control. PHENOTYPE:
|
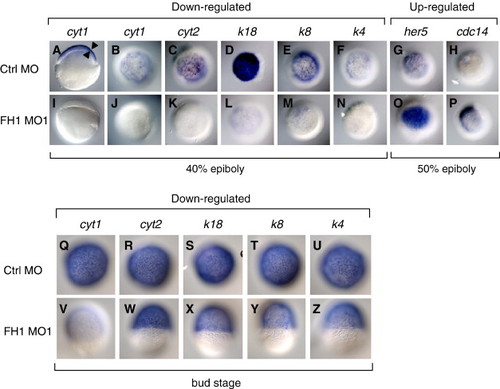
Down-regulation of keratins and up-regulation of cell cycle genes in FoxH1 morphants. (A, B, I and J) Loss of cyt1 expression in FoxH1-depleted embryos at 40% epiboly. Panels A and I are lateral views, panels B and J are animal pole views. Arrowheads in panel A point to the superficial expression of cyt1 in the enveloping layer (EVL). (C–F; K–N) Reduced expression of four other keratins in FoxH1 morphants at the 40% epiboly stage. (G–H; O–P) Increased expression of her5 and cdc14 expression in FoxH1 morphants at the 50% epiboly stage. Panels C–H and K–P are animal pole views. (Q–Z) Recovery of most keratins in FoxH1 morphants at bud stage. Panels Q–Z are dorsal views. Abbreviations: FH1, FoxH1; ctrl, control. EXPRESSION / LABELING:
|

Rescue of FoxH1 morphant phenotypes by co-injection of foxH1mRNA. (A–F) Rescue of selected molecular markers. Wild type embryos were injected with 8 ng of the indicated MO, or co-injected with 8 ng of the indicated MO together with 150 pg of foxh1 mRNA, then incubated and fixed at the indicated stages for whole-mount in situ analysis. Embryos in A–C are at bud stage, dorsal view. 100% (N = 29) of control embryos had strong staining, as in panel A, whereas 86% (N = 22) of FoxH1 morphants had no visible stain, as in panel B. When foxh1 mRNA was co-injected with FoxH1 MO1, 77% (N = 26) displayed moderate staining, as in panel C. Embryos in panels D–F are generally in an animal pole view orientation. A consistent increase in cyt1 expression is seen in embryos co-injected with foxh1 mRNA. (G–I) Rescue of dysmorphology caused by a low dose of FoxH1 MO1. Wild type embryos were injected with 4 ng of control MO, 4 ng of FoxH1 MO1, or 4 ng of FoxH1 MO1 + 150 pg foxh1mRNA, as indicated. 95% (N = 22) of control MO-injected embryos appeared WT, as in panel G and G2, whereas 68% (N = 41) of FoxH1 MO1-injected embryos displayed gross developmental perturbations. When foxh1 mRNA was co-injected with FoxH1 MO1, 89% (N = 47) displayed substantially milder phenotypes, and this milder phenotype was indistinguishable from the phenotype of WT embryos injected with foxH1 mRNA (data not shown, but see Fig. S1, C for comparison). Primes (2) indicate frontal views for the same embryos. Abbreviations: FH1, FoxH1; ctrl, control. |
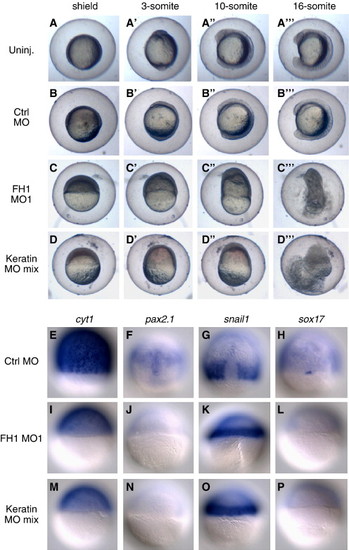
Co-depletion of keratins phenocopies the FoxH1 morphant phenotype. (A–D) Morphological similarity of FoxH1 morphants and keratin morphants. Wild type embryos were injected with 8 ng of FoxH1 MO1, 16 ng of control MO, or 16 ng of a mixture containing 8 ng, 2 ng, 2 ng, 2 ng and 2 ng of MOs respectively targeting the translation of Cyt1, Cyt2, Keratin 4, Keratin 8 and Keratin 18. Un-injected (Uninj.) embryos are also shown to illustrate the moderate delays associated with a high dose (16 ng) of control MO. Injected embryos were kept in their chorions and placed into conical wells formed in 2% agarose, then simultaneously time lapse documented. Primes (′) indicate different time points for the same embryos. Most views are lateral, however embryos were free to rotate during the time lapse and panel A′ is closer to a frontal or ventral view. (E–P) Co-depletion of keratins phenocopies marker expression in FoxH1 morphants. Wild type embryos were injected with 8 ng of FoxH1 MO1, 16 ng of control MO, or 16 ng of the keratin MO mixture mentioned above and fixed at 8 hpf, when control embryos reached 70% epiboly, for in situ analysis. Panels E–H are dorsal views, and panels I–P, for which the dorsal side could not be determined, are randomly oriented side views. Abbreviations: FH1, FoxH1; ctrl, control. EXPRESSION / LABELING:
PHENOTYPE:
|

Evidence that FoxH1 and Cyt1 act in the same pathway. (A–C) Similar effect of cyt1 and foxh1 mRNA over-expression on eye development. Wild type embryos were injected with 150 pg of foxh1 mRNA, 200 pg of cyt1 mRNA or 300 pg of gfp mRNA and scored after one day of development. No obvious defects arose from gfp mRNA injection. A reduced eye phenotype, as in B′, arose in 16% (N = 31) of embryos injected with cyt1 mRNA and a similar reduced eye phenotype, as in C′, arose in 23% (N = 39) of embryos injected with foxh1 mRNA. Primes (′) indicate the front view for the same embryos. (D–F) Cyt1 MO injection partially phenocopies the FoxH1 morphant phenotype. Wild type embryos were injected with 8 ng of the indicated MOs, embryos were dechorionated and soft-mounted in agar/agarose, then simultaneously time lapse documented. Primes (′) indicate different time points for the same embryos. Injection of both Cyt1 MO and FoxH1 MO caused epiboly delays at earlier stages (i.e. shield, 80% epiboly and 3-somite stages), and embryonic death later, at the 16-somite stage. However, the Cyt1 morphant phenotype was less severe than the FoxH1 morphant phenotype. (G–L) Reduced neurectodermal marker expression in both Cyt1 morphants and FoxH1 morphants. Wild type embryos were injected with 8 ng of the indicated MOs, then fixed at the bud stage (10 hpf) for whole mount in situ hybridization. G–I, lateral views, dorsal to the right. J–L, dorsal views, animal pole to the top. Signature markers were reduced in Cyt1 morphants, but reductions were more pronounced in FoxH1 morphants. EXPRESSION / LABELING:
PHENOTYPE:
|
Reprinted from Developmental Biology, 310(1), Pei, W., Noushmehr, H., Costa, J., Ouspenskaia, M.V., Elkahloun, A.G., and Feldman, B., An early requirement for maternal FoxH1 during zebrafish gastrulation, 10-22, Copyright (2007) with permission from Elsevier. Full text @ Dev. Biol.