
- Title
-
A gene network that coordinates preplacodal competence and neural crest specification in zebrafish
- Authors
- Bhat, N., Kwon, H.J., and Riley, B.B.
- Source
- Full text @ Dev. Biol.
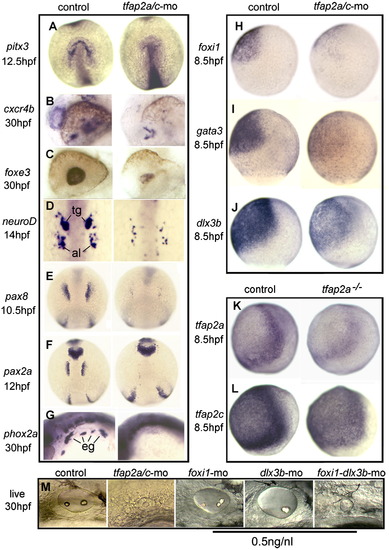
Knockdown of tfap2a/c impairs early placode development. A?G, Expression of early placodal markers in control embryos and tfap2a/c morphants. Expression of pitx3 at 12.5 hpf marks pituitary/olfactory/lens precursors (A); cxcr4b marks the olfactory pit at 30 hpf (B); foxe3 marks the lens at 30 hpf (C); neuroD marks the trigeminal (tg) and anterior lateral line (al) at 14 hpf (D); pax8 at 10 hpf (E) and pax2a at 12 hpf (F) mark otic/epibranchial precursors; phox2a marks epibranchial ganglia (eg) at 30 hpf (G). H?J, Expression of competence factors foxi1 (H) and gata3 (I), and PPE marker dlx3b (J), at 8.5 hpf in control embryos and tfap2a/c morphants. K and L, Expression of tfap2a (K) and tfap2c (L) at 8.5 hpf in control embryos and tfap2a-/- (lockjaw) mutants. M, otic vesicle at 30 hpf in a control embryo, tfap2a/c morphant, and embryos injected with sub-effective doses (0.5 ng) of foxi1-MO, dlx3b-MO or both foxi1-MO and dlx3b-MO. Sub-effective doses of these MO have little or no effect by themselves, but when combined have synergistic effects that phenocopy the tfap2a/c morphant. Images show dorsal views with anterior up (A, D?F), lateral views with anterior to the left (B, C, G, M) or lateral views with dorsal to the right (H?L). EXPRESSION / LABELING:
|
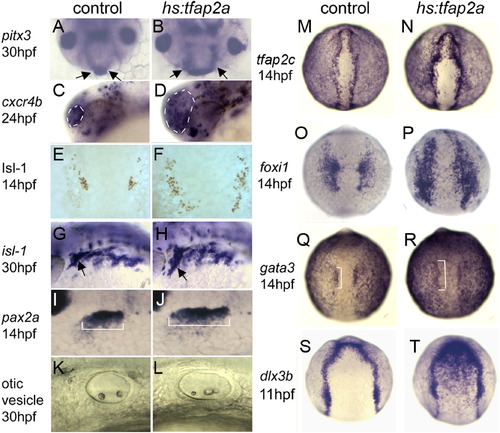
Misexpression of tfap2a promotes overproduction of placodes. A-L, Markers of placodal derivatives, including pitx3 in the anterior pituitary at 30 hpf (A and B, arrows), cxcr4b in the olfactory pit at 24 hpf (C and D, circled), Isl1 in trigeminal placode at 14 hpf (E and F), isl1 in cranial ganglia at 30 hpf (G and H, trigeminal ganglion indicated by arrows), pax2a in the otic/epibranchial placodes at 14 hpf (I and J, brackets indicate otic domain), and the otic vesicle at 30 hpf (K and L) in control embryos and hs:tfap2a/+ transgenic embryos. All indicated placodal derivatives are enlarged following activation of hs:tfap2a at 7 hpf. M?T, expression of competence factors tfap2c (M and N), foxi1 (O and P) and gata3 (Q and R, otic domain indicated by brackets) at 14 hpf, and the general PPE marker dlx3b at 11 hpf (S and T) in control embryos and hs:tfap2a embryos. Activation of hs:tfap2a at 7 hpf results in upregulated and expanded expression of all of these genes in placodal tissues. Images show lateral views with anterior to the left (C, D, G-L), dorsal views with anterior up (E, F, M-T), or facial views of the front of the head (A and B). EXPRESSION / LABELING:
PHENOTYPE:
|
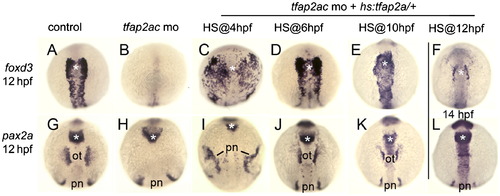
Temporal requirements for tfap2a/c. Expression of neural crest marker foxd3 at 12 hpf (A-E) and 14 hpf (F), and otic marker pax2a at 12 hpf (G-K) and 14 hpf (L) in control embryos (A and G), tfap2a/c morphants (B and H), and tfap2a/c morphants in which hs:tfap2a was activated (HS) at the indicated times (C-F, I-L). Expression domains of pax2a in the otic placode (ot) and pronephros (pn) are indicated, and the midbrain?hindbrain border region is marked with an asterisk. Cranial neural crest was rescued by activating hs:tfap2a at any time between late blastula stage (4 hpf) and 6 somite-stage (12 hpf), whereas rescue of the otic domain of pax2a required activation of the transgene during gastrulation (6-10 hpf). All images show dorsal views with anterior to the top. EXPRESSION / LABELING:
|
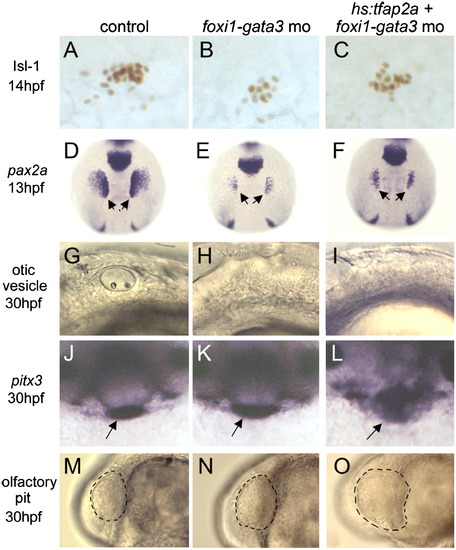
Unique requirements for foxi1 and gata3 in posterior placodes. Markers of cranial placodes and placodal derivatives, including Isl1 in the trigeminal placode at 14 hpf (A?C), pax2a in the otic/epibranchial placodes at 13 hpf (D-F, arrows), otic vesicle at 30 hpf (G-I), pitx3 in the anterior pituitary at 30 hpf (J-L, arrows) and the olfactory pit at 30 hpf (M?O, outlined) in control embryos (A, D, G, J and M), foxi1-gata3 morphants (B, E, H, K and N), and foxi1-gata3 morphants in which hs:tfap2a was activated at 7 hpf (C, F, I, L and O). Knockdown of foxi1 and gata3 reduces the size of the trigeminal, otic and epibranchial placodes, but anterior placodes develop normally. Activation of hs:tfap2a does not rescue development of posterior placodes in foxi1-gata3 morphants, and the transgene still enlarges anterior placodes despite knockdown of foxi1 and gata3. Images show lateral views with anterior to the right (A-C, G-I, M-O), dorsal views with anterior up (D-F), and facial views of the front of the head (J-L). EXPRESSION / LABELING:
PHENOTYPE:
|
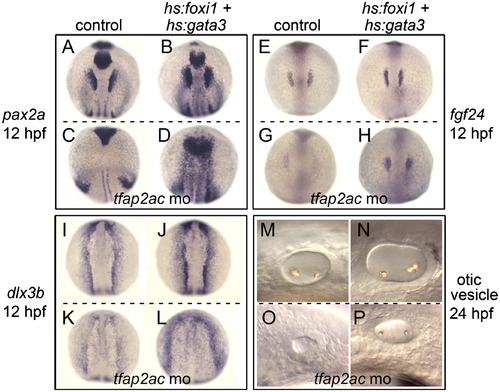
Co-misexpressing foxi1 and gata3 in tfap2a/c morphants. A-D, Expression of pax2a in the otic/epibranchial placodes at 12 hpf. E?H, Expression of fgf24 in the otic placode at 12 hpf. I?L, Expression of dlx3b in placodal tissues at 12 hpf. M-P, otic vesicle at 24 hpf. Non-transgenic controls and hs:foxi1-hs:gata3 double transgenic embryos are marked across the top, and the lower half of each panel shows tfap2a/c morphants and double transgenic tfap2a/c morphants. Activation of the transgenes at 7 hpf partially rescued otic development in tfap2a/c morphants. Images show dorsal views with anterior to the top (A-L) or lateral views with anterior to the left (M-P). EXPRESSION / LABELING:
PHENOTYPE:
|
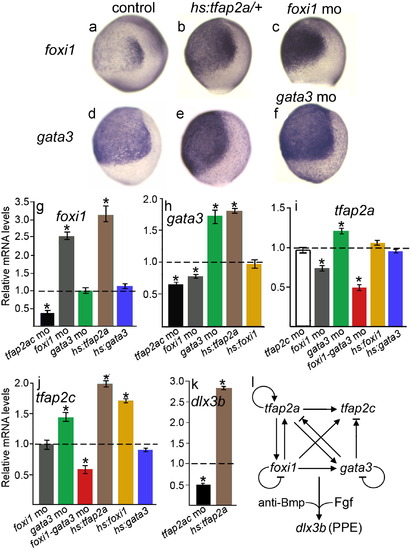
A network of auto- and cross-regulation amongst competence factors. Changes in expression levels of PPE regulatory genes near the end of gastrulation following misexpression or knockdown of the indicated genes. A-F, 10 hpf wholemount expression patterns of foxi1 (A-C) and gata3 (D-F) in control embryos (A, D), hs:tfap2a transgenic embryos (B and E), a foxi1 morphant (D) and a gata3 morphant (F). G?K, Quantitative real time PCR measurements of relative mRNA abundance for foxi1 (G), gata3 (H), tfap2a (I), tfap2c (J), and dlx3b (K) in the indicated backgrounds. Expression levels were normalized relative to wild-type controls, which are represented by dashed lines set at a value of 1.0. Genetic backgrounds are color coded to facilitate comparison between data sets: Black, tfap2a/c morphants; white, tfap2c morphants; gray, foxi1 morphants; green, gata3 morphants; red, foxi1-gata3 morphants; brown, hs:tfap2a; yellow, hs:foxi1; blue, hs:gata3. Data represent means of three independent experiments, each performed at two different dilutions, each measured in triplicate. The effects of gene misexpression were assayed at 10 hpf following heat shock at 7 hpf, and corresponding wild-type controls were also heat shocked at 7 hpf. Error bars represent standard deviations. Asterisks indicate statistically significant differences from the controls, as measured by t-tests. L, Model and summary of functional relationships between PPE competence factors and the general PPE marker, dlx3b. Arrows indicate positive regulation, cross-bars indicate negative regulation, and arrows with cross-bars indicate ambiguity in the data. Specifically, tfap2a and tfap2c are slightly upregulated in gata3 morphants but are strongly downregulated in foxi1-gata3 morphants. EXPRESSION / LABELING:
|
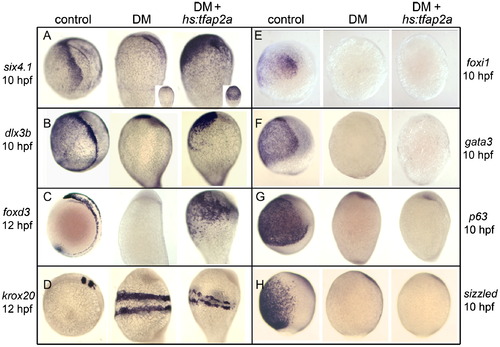
Misexpression of tfap2a rescues PPE and NC in Bmp-blocked embryos. Expression of PPE markers six4.1 (A) and dlx3b (B) at 10 hpf, NC marker foxd3 at 12 hpf (C), neural plate marker krox20 at 12 hpf (D), competence factors foxi1 (E) and gata3 (F) at 10 hpf, epidermal marker p63 at 10 hpf (G) and Bmp-feedback inhibitor sizzled at 10 hpf (H) in control embryos, embryos treated with 200 μM DM from 4 hpf, or hs:tfap2a/+transgenic embryos treated with 200 μM DM from 4 hpf and heat shocked at 6 hpf. Images show lateral views with dorsal to the right and anterior up. Insets in (A) show ventral views of corresponding specimens. Misexpression of tfap2a in DM-treated embryos rescues PPE and NC markers while causing slight disruption in stripes of krox20, but does not restore expression of other competence factors, p63 or sizzled. EXPRESSION / LABELING:
PHENOTYPE:
|
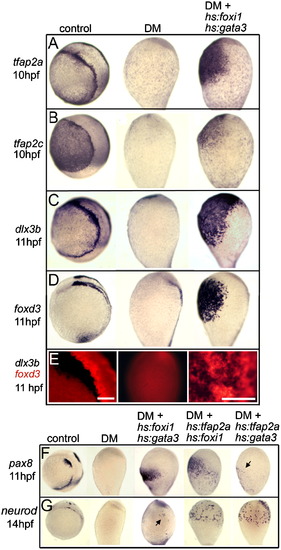
Effects of co-misexpressing pairs of competence factors in Bmp-blocked embryos. A?E, Expression of competence factors tfap2a (A) and tfap2c (B) at 10 hpf, PPE marker dlx3b at 11 hpf (C), NC marker foxd3 at 11 hpf (D), and two-color in situ hybridization to visualize patterns of dlx3b and foxd3 (E) in controls, embryos treated with 200 μM DM from 4 hpf, and hs:foxi1/+; hs:gata3/+ transgenic embryos treated with 200 μM DM from 4 hpf and heat shocked at 6 hpf. All markers show rescue in DM-treated embryos following transgene activation. Two-color staining in (E) shows a dorsolateral view of the hindbrain area in a control embryo, a lateral view of a whole DM-treated embryo (dorsal to the right), and a close-up of the ventral midline of a rescued DM-treated transgenic embryo in which dlx3b and foxd3 are expressed in intermingled, largely non-overlapping clumps of cells. Scale bars, 100 μm. F and G, Expression of otic/epibranchial marker pax8 at 11 hpf (F) and trigeminal/anterior lateral line marker neurod at 14 hpf (G) in control embryos, embryos treated with 200 μM DM from 4 hpf, or in embryos carrying the indicated combinations of transgenes treated with 200 μM DM from 4 hpf and heat shocked at 6 hpf. Arrows point to weak, scattered expression of pax8 or neuroD in various backgrounds. EXPRESSION / LABELING:
PHENOTYPE:
|
Reprinted from Developmental Biology, 373(1), Bhat, N., Kwon, H.J., and Riley, B.B., A gene network that coordinates preplacodal competence and neural crest specification in zebrafish, 107-117, Copyright (2013) with permission from Elsevier. Full text @ Dev. Biol.