
Fig. 6
- ID
- ZDB-FIG-130123-70
- Publication
- Bhat et al., 2013 - A gene network that coordinates preplacodal competence and neural crest specification in zebrafish
- Other Figures
- All Figure Page
- Back to All Figure Page
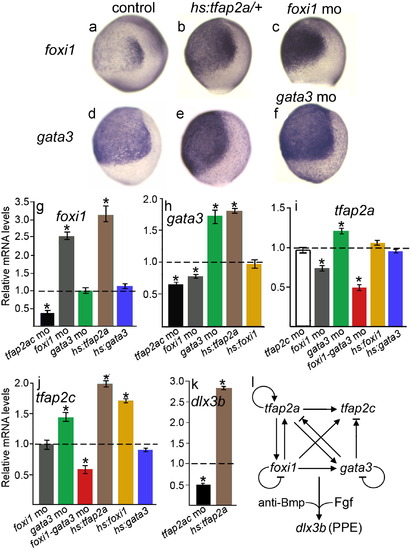
A network of auto- and cross-regulation amongst competence factors. Changes in expression levels of PPE regulatory genes near the end of gastrulation following misexpression or knockdown of the indicated genes. A-F, 10 hpf wholemount expression patterns of foxi1 (A-C) and gata3 (D-F) in control embryos (A, D), hs:tfap2a transgenic embryos (B and E), a foxi1 morphant (D) and a gata3 morphant (F). G–K, Quantitative real time PCR measurements of relative mRNA abundance for foxi1 (G), gata3 (H), tfap2a (I), tfap2c (J), and dlx3b (K) in the indicated backgrounds. Expression levels were normalized relative to wild-type controls, which are represented by dashed lines set at a value of 1.0. Genetic backgrounds are color coded to facilitate comparison between data sets: Black, tfap2a/c morphants; white, tfap2c morphants; gray, foxi1 morphants; green, gata3 morphants; red, foxi1-gata3 morphants; brown, hs:tfap2a; yellow, hs:foxi1; blue, hs:gata3. Data represent means of three independent experiments, each performed at two different dilutions, each measured in triplicate. The effects of gene misexpression were assayed at 10 hpf following heat shock at 7 hpf, and corresponding wild-type controls were also heat shocked at 7 hpf. Error bars represent standard deviations. Asterisks indicate statistically significant differences from the controls, as measured by t-tests. L, Model and summary of functional relationships between PPE competence factors and the general PPE marker, dlx3b. Arrows indicate positive regulation, cross-bars indicate negative regulation, and arrows with cross-bars indicate ambiguity in the data. Specifically, tfap2a and tfap2c are slightly upregulated in gata3 morphants but are strongly downregulated in foxi1-gata3 morphants. |
| Genes: | |
|---|---|
| Fish: | |
| Condition: | |
| Knockdown Reagents: | |
| Anatomical Term: | |
| Stage: | Bud |
Reprinted from Developmental Biology, 373(1), Bhat, N., Kwon, H.J., and Riley, B.B., A gene network that coordinates preplacodal competence and neural crest specification in zebrafish, 107-117, Copyright (2013) with permission from Elsevier. Full text @ Dev. Biol.