
- Title
-
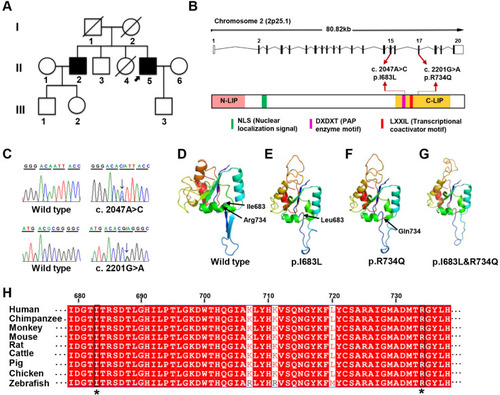
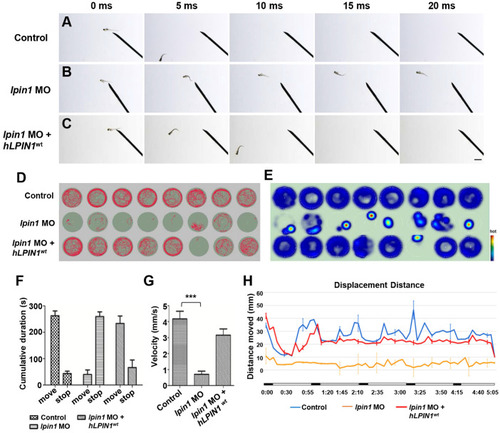
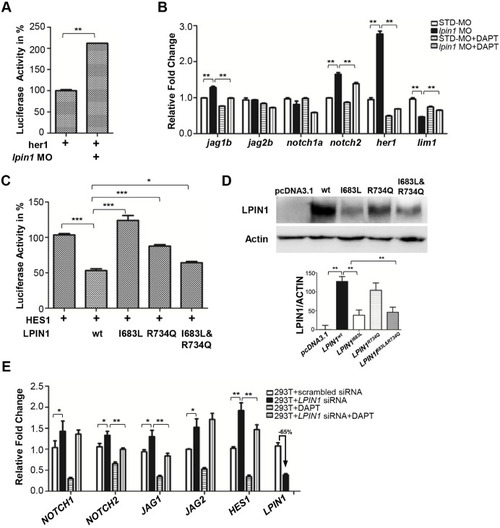
Lipin 1 deficiency causes adult-onset myasthenia with motor neuron dysfunction in humans and neuromuscular junction defects in zebrafish
- Authors
- Lu, S., Lyu, Z., Wang, Z., Kou, Y., Liu, C., Li, S., Hu, M., Zhu, H., Wang, W., Zhang, C., Kuan, Y.S., Liu, Y.W., Chen, J., Tian, J.
- Source
- Full text @ Theranostics
|
|

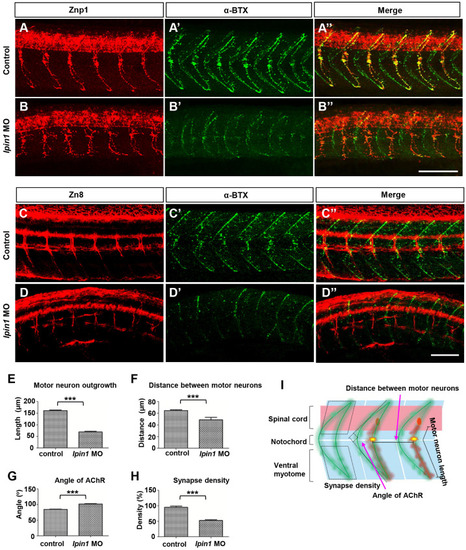
PHENOTYPE:
|
|
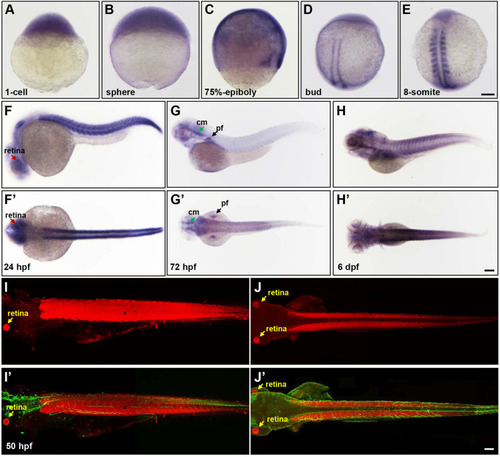
EXPRESSION / LABELING:
PHENOTYPE:
|
|

EXPRESSION / LABELING:
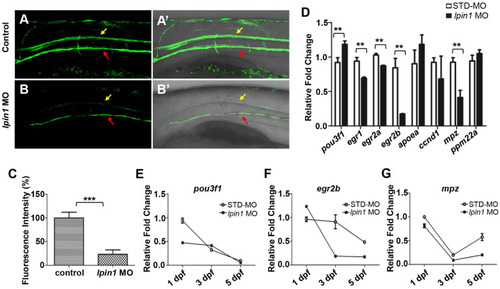
PHENOTYPE:
|
|

ZFIN is incorporating published figure images and captions as part of an ongoing project. Figures from some publications have not yet been curated, or are not available for display because of copyright restrictions. |
|
ZFIN is incorporating published figure images and captions as part of an ongoing project. Figures from some publications have not yet been curated, or are not available for display because of copyright restrictions. |
|
ZFIN is incorporating published figure images and captions as part of an ongoing project. Figures from some publications have not yet been curated, or are not available for display because of copyright restrictions. |