
- Title
-
DNA demethylase activity maintains intestinal cells in an undifferentiated state following loss of APC
- Authors
- Rai, K., Sarkar, S., Broadbent, T.J., Voas, M., Grossmann, K.F., Nadauld, L.D., Dehghanizadeh, S., Hagos, F.T., Li, Y., Toth, R.K., Chidester, S., Bahr, T.M., Johnson, W.E., Sklow, B., Burt, R., Cairns, B.R., and Jones, D.A.
- Source
- Full text @ Cell

Upregulation of DNA Demethylase Components, and Hypomethylated Genes in apc Mutant Embryos and FAP Adenomas (A–D) Whole-mount in situ staining for aid (A), apobec2a (A), apobec2b (A), mbd4 (B), tdg (B), gadd45α (C), gadd45βlike (C), gadd45β (C), gadd45γ (C), and dnmt1 (D) in apc mutants (apcmcr) and siblings (apcwt) zebrafish embryos at 72 hpf. (E) MeDIP-qPCR for genes shown (selected from genome-wide MeDIP-ChIP microarray analysis) in apcmcr and apcwt (72 hpf) that are either uninjected or injected with aaa Mo (combination of aid, apobec2a, and apobec2b morpholinos; 0.5 ng each) or mbd4 and tdg morpholinos together (1 ng each) or V5-Dnmt1 expressing plasmid (1 pg, an amount that rescues Dnmt1 morphants with 97% knockdown of Dnmt1 levels). Dnmt1 protein levels are in Figure S1C. (F) MeDIP-qPCR for genes shown (selected from genome-wide MeDIP-ChIP microarray analysis) in human adenomas (A) and matching uninvolved tissues (U) from FAP patients. P1-P10 refers to ten different patients. In both (E) and (F), the y axis shows values for each promoter region normalized to a negative control region lacking CpGs and then normalized to the values from wild-type or uninvolved, valued at 1. Error bars indicate ± standard deviation (SD). See also Figure S1. EXPRESSION / LABELING:
PHENOTYPE:
|
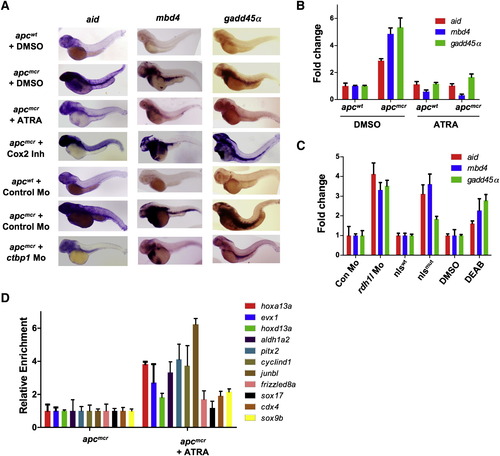
APC Negatively Regulates Demethylase Expression via Retinoic Acid (A) Whole-mount in situ staining for aid, gadd457alpha;, and mbd4 in apcmcr and apcwt embryos treated with DMSO, all-trans retinoic acid (ATRA, 1 μM), or Cox-2 inhibitor NS-398 (10 μM) or injected with control morpholino or ctbp1 morpholino (2 ng). β-catenin knockdown efficiency with NS-398 treatment is depicted in Figure S2A. (B and C) Quantitative RT-PCR for aid, mbd4, and gadd45α in apcmcr and apcwt embryos treated with DMSO or ATRA (B) or in different RA deficiency models in zebrafish, as shown in (C). Expression of genes are first normalized to 28S and then to the control embryo mRNA/28S ratio, valued as 1. (D) MeDIP-qPCR for genes shown (as in Figure 1E) in apc mutants (72 hpf) that are either untreated or treated with ATRA. Error bars indicate ± SD. See also Figure S2. EXPRESSION / LABELING:
PHENOTYPE:
|

Pou5f1 and Cebpβ Directly Regulate aid, mbd4, and gadd45α Expression in apcmcr Embryos (A) Whole-mount in situ staining for aldh1a2 in apcmcr and apcwt at 72 hpf. (B and C) Whole-mount in situ staining for fabp2 in apcmcr and apcwt embryos (B) or in control morphant and rdh1l morphant embryos (C) (at 72 hpf) treated with vehicle or RAL (2 μM). (D) RT-PCR for Pou5f1 (Oct4) and Cebpβ in apcmcr and apcwt treated with DMSO or ATRA (1 μM). The y axis shows fold induction normalized to 28S and wild-type DMSO-treated sample. (E and F) Whole-mount in situ staining for aid, gadd45α, and mbd4 in apcmcr and apcwt injected with control, Pou2f1a, pou5f1, or cebpβ Mo (E) or in wild-type embryos injected with control, Pou2f1, pou5f1, or cebpβ expression plasmid (F). (G) Graph showing fold enrichment near the aid or gadd45α TSS (containing overlapping Oct and Cebp binding sites) for Cebpβ and Pou5f1 in embryos injected with V5-Cebpβ- (along with Pou5f1 Mo, 80 pg), V5-Pou5f1-, or FLAG-Pou2f1-expressing plasmids. ChIP was performed with antibodies against the tags. Normalization control primers are located not, ~3 kb upstream (region without Cebpβ sites) of the TSS of the Gadd45α gene. Error bars indicate ± SD. See also Figure S3. EXPRESSION / LABELING:
PHENOTYPE:
|
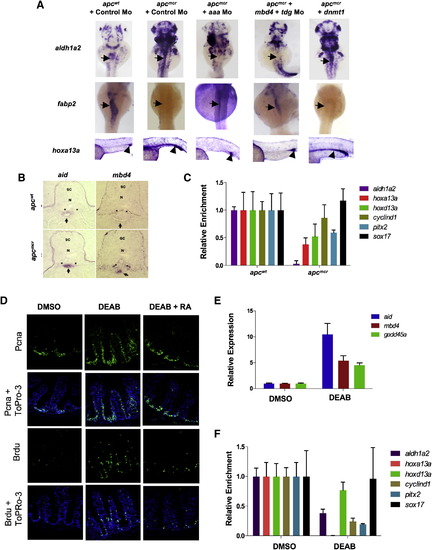
Demethylase Activity Is Required to Maintain Progenitor Cell Populations in apc Mutants (A) Whole-mount in situ staining for aldh1a2, fabp2, and hoxa13a in apcmcr and apcwt embryos injected with control Mo, aaa Mo, combined mbd4 and tdg Mo, or overexpression of dnmt1 as in Figure 1. (B) Cross-sections of the intestines of apcmcr and apcwt embryos whole-mount in situ stained with aid (52 hpf) or mbd4 (72 hpf). Asterisks show pronephric ducts, and arrows point to the intestine. N, notochord; SC, spinal cord. (C) MeDIP-qPCR for genes shown in the GFP-positive cells from gutGFP;apcmcr and gutGFP;apcwt embryos (72 hpf). FACS parameters and efficiency are shown in Figures S4A and S4B. (D–F) Immunostaining (D), RT-PCR (E), and Me-DIP PCR (F) for the indicated genes in the intestines from adult wild-type zebrafish treated with DMSO or DEAB for 7 days. In (E), RT-PCR was performed on epithelial cells isolated from the intestinal crypts. Error bars indicate ± SD. See also Figure S4. EXPRESSION / LABELING:
PHENOTYPE:
|

Lef1 and Groucho2 Suppress rdh1l in apcmcr Zebrafish (A) Whole-mount in situ staining for lef1, groucho2, tcf4, or groucho3 in apcwt and apcmcr embryos at 72 hpf. Red arrow points to the intestine. (B) Whole-mount in situ staining for fabp2, trypsin, rdh1l, and irbp in apcmcr/control Mo, apcmcr /lef1 Mo, and apcmcr /groucho2 Mo embryos at 72 hpf. Groucho2 mo efficiency is in Figure S5G. (C and D) ChIP for Lef1 on rdh1l promoter in apcwt and apcmcr embryos. (C) Schematic showing the Lef1 sites on the rdh1l promoter and location of the primer set P1 (containing Lef1 sites) and P2 (without Lef1 sites). (D) Graph showing fold enrichment of Lef1 occupancy at P1/P2 on rdh1l promoter in apcmcr embryos compared to apcwt at 72 hpf. Lef1 values were normalized to ones obtained with a nonspecific antibody and then expressed as fold enrichment compared to apcwt. Error bars indicate ± SD. (E) Whole-mount in situ staining for fabp2 and gata6 in 72 hpf embryos injected with full-length lef1 or dominant negative (deficient in β-catenin binding) lef1 mRNA alone or with groucho2 mRNA. See also Figure S5. EXPRESSION / LABELING:
PHENOTYPE:
|
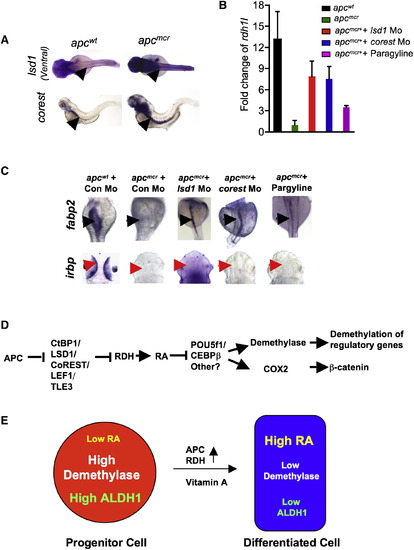
Lsd1 Represses rdh1l Expression and Intestinal Differentiation, and a Model for Retinoic Acid Regulation of DNA Methylation Dynamics (A) Whole-mount in situ staining for lsd1 and corest in the intestine (arrows) of apcmcr and apcwt embryos (72 hpf). (B) Fold change in rdh1l expression compared to 28S levels in apcwt and apcmcr embryos injected with control/lsd1/corest Mo or treated with pargyline (to inhibit Lsd1 activity). Error bars indicate ± SD. Lsd1 and Corest morpholino knockdown efficiency is shown in Figures S7A and S7B. (C) Whole-mount in situ staining for fabp2 and irbp in apcmcr and apcwt embryos injected with control/lsd1/corest Mo or treated with pargyline (3 mM). (D and E) Model of APC regulation of intestinal fating via retinoic acid and demethylase. APC promotes RA production by directly negatively regulating CtBP1 levels in a proteasome-dependent fashion. APC also inhibits the transcription of LSD1, CoREST, LEF1, and TLE3. LEF1 binds to the RDH promoter and recruits TLE3 (Groucho2)/CtBP1/LSD1 repressors, which silence RDH expression. Retinoic acid negatively regulates demethylase components by inhibiting Pou5f1 and Cebpβ. Furthermore, regulation of demethylase components by APC is independent of β-catenin. Demethylase promotes the demethylation of key fate regulators (like aldh1a2, hoxa13a, evx1) and proliferative genes (like cyclind1 and pitx2). Fate regulators like aldh1a2 possibly help in maintaining a progenitor cell population. See also Figure S7. EXPRESSION / LABELING:
PHENOTYPE:
|
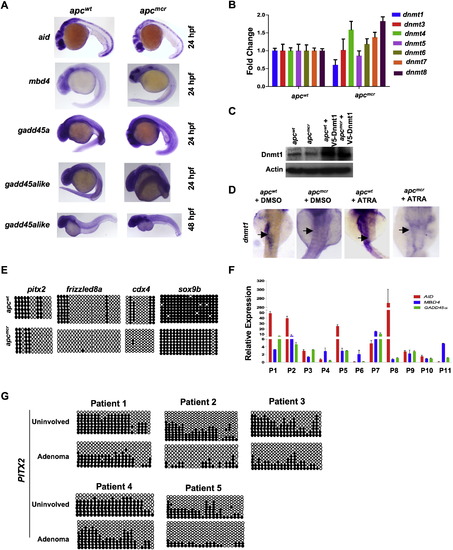
Expression of Demethylase Genes and dnmt1 and Verification of Hypomethylated Genes in apc Mutant Zebrafish Embryos, Related to Figure 1 (A) Whole mount in situ staining for aid, mbd4, gadd45α and gadd45αlike in apc mutants (apcmcr) and siblings (apcwt) embryos. Lateral view is shown for 24hpf and 48hpf old embryos. (B) RT-PCR measuring levels of all zebrafish DNA methyltransferases in apcmcr and apcwt embryos. y axis shows fold change normalized to 28S levels first and then to dnmt/28 s ratio from apcwt, valued as 1. (C) Western blots showing Dnmt1 levels in apcmcr and apcwt embryos injected with V5-Dnmt1 plasmid. Upper panel is probed with an antibody generated against zebrafish Dnmt1. Actin is used as a loading control. (D) Whole mount in situ staining for dnmt1 in apcmcr and apcwt embryos treated with DMSO or ATRA (1μM). Black arrow points to the expression in intestine. (E) Circle diagram showing bisulfite sequencing results for pitx2, frizzled8, cdx4 and sox9b promoter in apcmcr and apcwt embryos at 72hpf. (F) RT-PCR showing expression of AID, GADD45α and MBD4 in adenoma tissues isolated from FAP patients (patients bearing mutations in APC gene). P1 through P11 refers to patient′s sample ID. y axis values are fold changes in expression of indicated genes in adenoma tissues normalized first to 28S levels and then to mRNA/28S ratio from matching uninvolved tissue, valued as 1. Error bars are +/- SD. (G) Circle diagram showing bisulfite sequencing results for PITX2 promoter in adenoma and normal-appearing tissue from five different FAP patient samples. Circles represent methylation status of cytosines which are located in CpG contexts. Unmethylated cytosines are shown by open circle whereas closed circles depict methylated cytosines. |
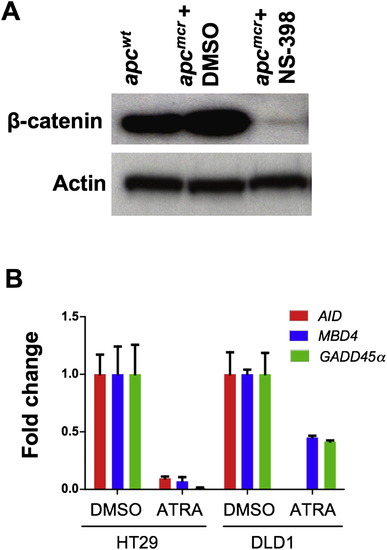
Knockdown of β-Catenin Levels by Cox-2 Inhibitor and Rescue of Demethylase by Retinoic Acid, Related to Figure 2 (A) Western blot showing levels of β-catenin in apcwt and apcmcr zebrafish embryos (72hpf) treated with DMSO (vehicle) or NS-398 (Cox-2 inhibitor, 10 μM). Actin was used as a loading control. (B) RT-PCR showing expression of AID, GADD45α and MBD4 in HT29 and DLD1 cells treated with vehicle (DMSO) or ATRA (1μM). y axis values are fold changes in expression of indicated genes in ATRA treated cells normalized first to 28S levels and then to mRNA/28S ratio from DMSO treated cells, valued as 1. Error bars are +/- SD. |

Retinoic Acid and Pou5f1 Regulate aldh1a2 and Demethylase Gene Expression in apc Mutant Zebrafish Embryos, Related to Figure 3 (A) Whole mount in situ staining for hnf1β, gata5, gata6, foxa3 and hnf4α in apcmcr and apcwt embryos at 72hpf. (B) Whole mount in situ staining for aldh1a2 in apcmcr and apcwt embryos at 36hpf, 48hpf and 56hpf. (C) Graph showing fold change obtained from RT-PCR for aldh1a2 expression in apcmcr and apcwt embryos treated with DMSO or ATRA. (D) Immunoblot analysis for Aldh1a2 in apcwt and apcmcr zebrafish embryos at 72hpf. Actin is used as a loading control. (E) Graph showing fold change obtained from RT-PCR for aldh1a2 expression in control morphants and rdh1l morphants treated with DMSO or ATRA. (F) Graph showing fold change obtained from RT-PCR for aldh1a2 expression in nls (neckless) wild-type or nls mutant embryos treated with DMSO or ATRA. (G and H) Whole mount in situ staining for apobec2a and apobec2b (G) and aid, mbd4 and gadd45a (H) in embryos injected with control, pou5f1 or cebpβ expressing plasmids. In panel H, black arrows show expression in the intestine. (I) Whole mount in situ staining for aldh1a2 in apcmcr and apcwt (at 72hpf) injected with control Mo or pou5f1 Mo (80pg). (J) Graph showing fold change obtained from RT-PCR for aldh1a2 expression in apcmcr and apcwt embryos injected with control morpholino or pou5f1 morpholino. y axis values are fold changes in expression of indicated genes normalized first to 28S levels and then to mRNA/28S ratio from control samples, valued as 1. Error bars are +/- SD. |
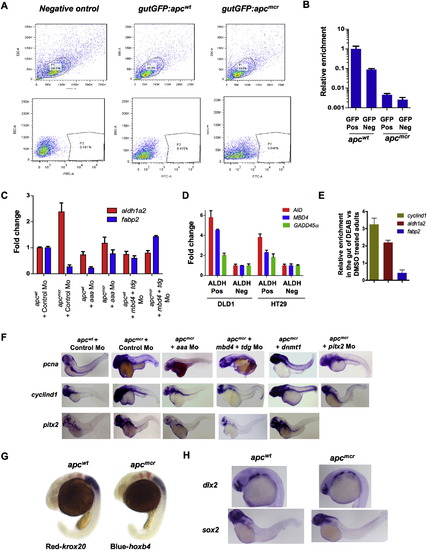
Sorting of Intestine-Specific Cells and Requirement of Demethylase for Aberrant Expression of aldh1a2, fabp2, pcna, cyclind1 and pitx2 in apc Mutant Zebrafish Embryos, Related to Figure 4 (A) FACS sorting parameters for GFP negative apcwt embryos, gutGFP;apcmcr and gutGFP;apcwt embryos. (B) Fabp2 expression in GFP positive and negative sorted cells from gutGFP;apcmcr and gutGFP;apcwt embryos. (C) RT-PCR showing aldh1a2 and fabp2 expression in apcmcr and apcwt embryos injected with control Mo/ aaa Mo/ mbd4+tdg Mo. Error bars are +/- SD. (D) Quantitative RT-PCR for AID, MBD4 and GADD45A in ALDH positive or negative fractions (FACS sorted using aldefluor assay) of DLD1 and HT29 cells. Fold enrichment was assessed over 18S expression levels and values from ALDH negative fraction were normalized as 1. (E) Relative expression of cyclind1, aldh1a2 and fabp2 in the intestines of adult zebrafish treated with DMSO or DEAB for 7 days. (F) Whole mount in situ staining for pcna, cyclind1 and pitx2 in apcmcr and apcwt zebrafish embryos injected with control Mo, aaa Mo, mbd4/tdg Mo, pitx2 Mo, or dnmt1 expression plasmid. (G and H) Whole mount in situ for krox20 and hoxb4 (panel G, krox20 in red and hoxb4 in blue at 24hpf) and dlx2 and sox2 (panel H, dlx2 at 24hpf and sox2 at 72hpf) in apcmcr and apcwt embryos. |
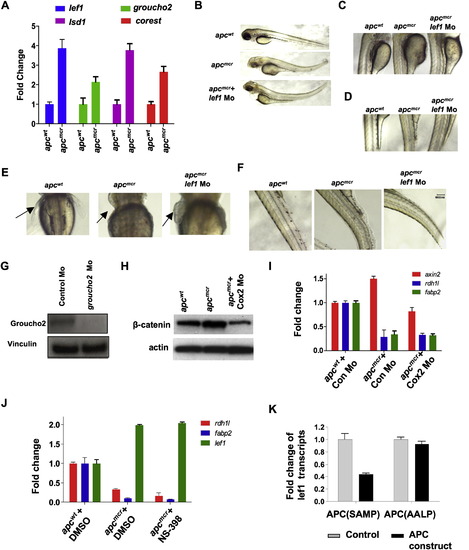
Expression of lef1, groucho2, lsd1 and corest in apc Mutant Zebrafish Embryos and their Knockdown with Morpholino, Related to Figure 5 (A) Quantitative RT-PCR showing fold upregulation of lef1, groucho2, lsd1 and corest in apcmcr zebrafish compared apcwt embryos. Transcript levels normalized to 28S rRNA transcripts and then to wild-type values. (B–F) Bright light images showing gross morphological rescue (B), rescue of yolk structure (C and D), rescue of pectoral fins (marked by arrowhead) (E), and rescue of the somite organization (F) in apcmcr zebrafish injected with lef1 morpholino. Note increased body length of apcmcr zebrafish injected with lef1 Mo compared to uninjected embryos in panel B. (G) Western blot showing levels of Groucho2 in apcmcr zebrafish embryos (72hpf) injected with control Mo or Groucho2 Mo. Vinculin was used as a loading control. (H) Western blot showing levels of β-catenin in apcwt and apcmcr zebrafish embryos (72hpf) injected with control Mo or Cox-2 Mo. Actin was used as a loading control. (I and J) RT-PCR for indicated genes in apcwt and apcmcr embryos injected with control Mo or Cox-2 Mo (I) or treated with DMSO or NS-398 (J). Fold change indicates transcripts levels normalized first to 28S and then to wild-type values, normalized as 1. (K) RT-PCR results for lef1 in apcmcr embryos injected with wild-type APC (APC SAMP) expressing DNA or a mutant deficient in Axin binding (APC AALP). PHENOTYPE:
|

Lsd1 and Ctbp1 Are Upregulated in apc Mutant Zebrafish Embryos, Related to Figure 7 (A) Immunoblot showing that apcmcr zebrafish embryos express higher levels of Lsd1 and Ctbp protein compared to apcwt siblings (at 72hpf). Vinculin is used as a loading control. (B and C) apcmcr zebrafish were injected with lsd1/corest/control morpholino at the one cell stage. Total protein was harvested at 72hpf. Immunoblotting was performed with the indicated antibodies. |
Reprinted from Cell, 142(6), Rai, K., Sarkar, S., Broadbent, T.J., Voas, M., Grossmann, K.F., Nadauld, L.D., Dehghanizadeh, S., Hagos, F.T., Li, Y., Toth, R.K., Chidester, S., Bahr, T.M., Johnson, W.E., Sklow, B., Burt, R., Cairns, B.R., and Jones, D.A., DNA demethylase activity maintains intestinal cells in an undifferentiated state following loss of APC, 930-942, Copyright (2010) with permission from Elsevier. Full text @ Cell