- Title
-
Evolutionarily conserved roles of foxg1a in the developing subpallium of zebrafish embryos
- Authors
- Umeda, K., Tanaka, K., Chowdhury, G., Nasu, K., Kuroyanagi, Y., Yamasu, K.
- Source
- Full text @ Dev. Growth Diff.
|
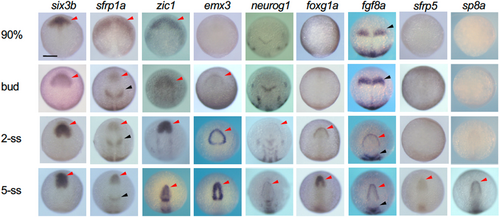
Expression of genes involved in establishment of the anterior neural border and early telencephalon development. The expression of regulatory genes from late gastrulation to early somite stages were stained by WISH. ANK and MHB are shown with red and black arrowheads. Scale bar, 100 μm. EXPRESSION / LABELING:
|
|
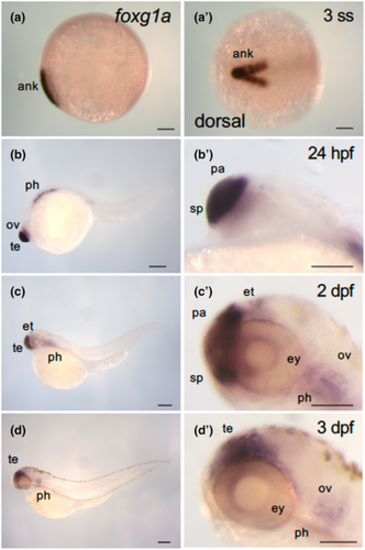
Dynamic expression of foxg1a during the course of zebrafish development. Expression of foxg1a was examined by WISH in wild-type embryos from the early somite stage through 3 dpf. (a–d, b′–d′) Lateral views of the entire bodies (a–d) and heads (b′–d′) with anterior to the left, dorsal to the top. (a′) Dorsal view, with anterior to the left. foxg1a expression was detected in the anterior neural keel from the two-somite stage (2-ss; Figure 1a, a′). At 24 hpf, foxg1a expression was detected in the telencephalon, including the preoptic area, optic vesicle, and pharyngeal arch. At 2 dpf, foxg1a expression was detected in the telencephalon, eyes, epithalamus, and pharyngeal arches. At 3 dpf, foxg1a expression was also found in the telencephalon, eyes, and pharyngeal arches. ank, anterior neural keel; ov, optic vesicle; pa, pallium; ph, pharyngeal arch; sp, subpallium; te, telencephalon. Scale bar, 100 μm. EXPRESSION / LABELING:
|
|
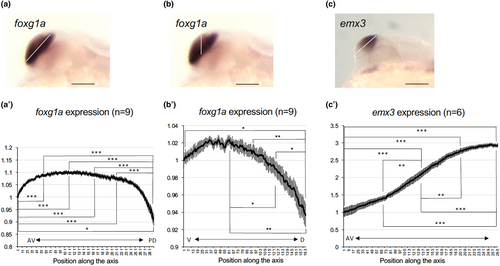
Graded expression of foxg1a and emx3 in the developing telencephalon of wild-type embryos. Expression intensity of foxg1a (a, b, a′, b′) and emx3 (c, c′) in the telencephalon was quantified at 24 hpf along its major axis (anteroventral end to posterodorsal end, white line in (a) and (c)) or vertical axis (ventral to dorsal, white line in (b)) by ImageJ (a'-c'). The staining intensities shown in the graph are the average values of nine embryos (foxg1a) or six embryos (emx3). Average values relative to those at the anteroventral/ventral-most ends are shown along the ordinate with error bars showing SEMs. The abscissa shows positions along the axis set for each quantification. AV, anteroventral; PD, posterodorsal; V, ventral; D, dorsal. *p < .05; **p < .01; ***p < .001. EXPRESSION / LABELING:
|
|
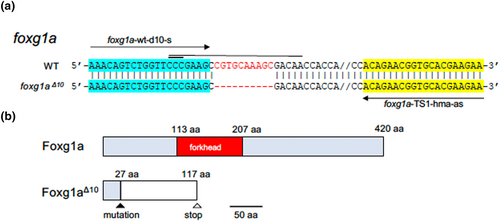
Mutations introduced into foxg1a. (a) The sequence around the site of mutation, introduced into foxg1a by the CRISPR/Cas9 method, is shown, with the wild-type sequence at the top and the mutated sequence at the bottom. Hyphens show introduced nucleotide deletions, and double dashes show the sequences omitted for convenience's sake. A horizontal thin line and thick line show the target sequence and PAM sequence, respectively. Horizontal arrows show the sequences of primers used for HMA, which are also highlighted. (b) Schematic views of the wild-type and mutant products of foxg1a. Light-blue boxes show the wild-type coding sequences, but for the functional domain that is shown in red instead, whereas the white box shows the nonsense open reading frame generated as a result of the frameshift mutation. |
|
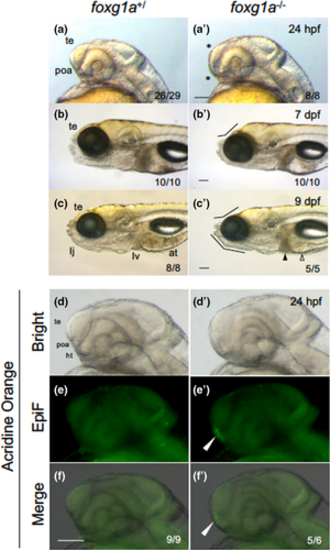
Morphological defects in foxg1a mutant fish. (a–c, a′–c′) Morphology of the heads of embryos/larvae obtained by heterozygotic mating of foxg1a mutant fish (foxg1a+/∆10) was observed at 24 hpf (a, a′), 7 dpf (b, b′), and 9 dpf (c, c′), followed by genotyping. For each stage, wild-type fish and homozygotes (−/−) are shown. In fact, heterozygotes were indistinguishable from wild-type embryos and are not shown. In homozygotes, the telencephalon was thinner and the POA region was deformed at 24 hpf (asterisks, a′). At 7 and 9 dpf, depression of the anterodorsal head and reduced lower jaws were observed (flexed lines, b′, c′), cell death was observed in the liver (solid triangle), and the alimentary tract was often empty (open triangle). (d–f, d′–f′) Embryos obtained by heterozygotic mating of foxg1a mutant fish (foxg1a+/Δ10) were examined by acridine orange (AO) staining at 24 hpf and then genotyped. Wild type and homozygotes are shown on the left and right, respectively. Heterozygotes were indistinguishable from wild-type embryos and are not shown. Lateral views of the head, with anterior to the left and dorsal to the top. Bright-field images, epifluorescence images (EpiF), and merged images are shown from top to bottom. On the bottom right are shown the numbers of embryos with the shown phenotypes and the numbers of embryos with the shown genotypes, respectively. at, alimentary tract; ht, hypothalamus; poa, preoptic area; te, telencephalon. Scale bar, 100 μm. |
|
Quantification of the size of the telencephalon in foxg1a mutants. The sizes of the telencephalon were quantified using ImageJ. The telencephalic region was selected by the segmented line tool for each genotype as shown in (a–a″) (white dashed lines), and the area was quantified (b). (a–a″) Lateral views of the head, with anterior to the left and dorsal to the top. The embryos in (a) and (a″) correspond to those in Figure 3a, b. poa, preoptic area; te, telencephalon. Scale bar, 100 μm. (b) Four clutches were quantified independently, resulting in similar results, and representative data are shown. Average values for respective genotypes are shown relative to those for the wild-type embryos with error bars showing SEMs and the numbers of embryos scored in this experiment. *p < .05. Numbers at the bottom right in (a–a″) indicate the total numbers of embryos showing the features shown and the total numbers of scored embryos with respective genotypes, respectively, all of which are combined numbers from the four independent experiments. PHENOTYPE:
|
|
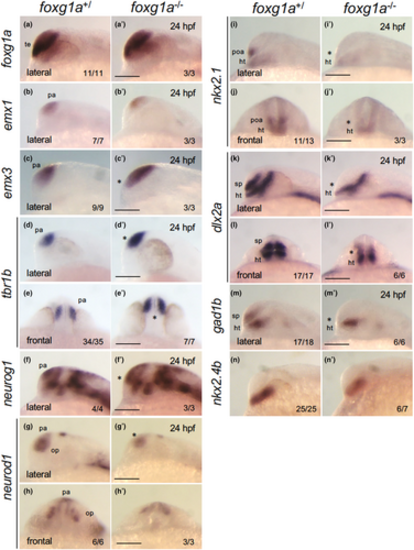
Expression of genes involved in dorsoventral patterning of the telencephalon in foxg1a mutants at 24 hpf. The expression of foxg1a, pallium markers (emx1, emx3, tbr1b, neurog1, neurod1), a POA/medial ganglionic eminence/hypothalamus marker (nkx2.1), and subpallium markers (dlx2a, gad1b) was examined by WISH in foxg1a mutants at 24 hpf, followed by genotyping. For each gene, there was no difference between +/+ and +/− embryos, and the data for wild type/heterozygous (+/) and for homozygotes (−/−) are shown on the left and right, respectively. The numbers of embryos with the indicated patterns and those of embryos with the indicated genotypes are shown on the bottom right. Asterisks indicate abnormal expression. Lateral views of the head with anterior to the left and dorsal to the top, except for (e, e′, h, h′, j, j′, l, l′), where frontal views of the head are shown with dorsal to the top. ht, hypothalamus; op, olfactory placode; pa, pallium; poa, preoptic area; sp, subpallium; te, telencephalon. Scale bar, 100 μm. |
|
Semi-quantitative analysis of emx3 expression in foxg1a mutants. The emx3 expression pattern in the telencephalon was quantified by ImageJ. After selecting stained regions based on a brightness threshold (a–a‴, yellow line), the areas, staining intensities, major axes, and minor axes were quantified for respective genotypes. (a–a‴) Wild type (+/+), a heterozygous mutant (+/−), and a homozygous mutant (−/−) are shown in this order from left to right. At the bottom right are shown the numbers of embryos with the indicated patterns and those of embryos with the indicated genotypes. The embryos in (a) and (a”) correspond to those in Figure 5c, c′. Lateral views of the head with anterior to the top. Scale bar, 100 μm. (b) Quantification of the emx3 expression patterns. Average values for each genotype are shown relative to the average for wild-type embryos, with error bars showing SEMs. *p < .05. |
|
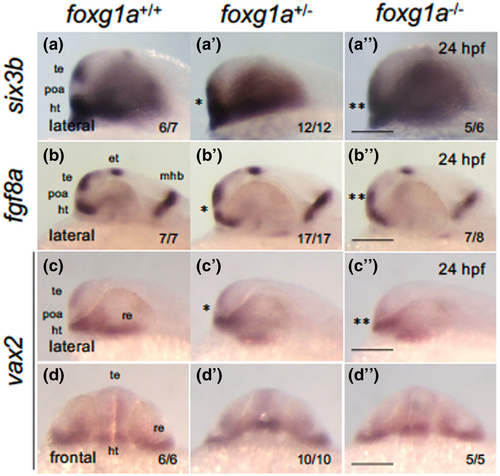
Expression of forebrain-forming genes in foxg1a mutants at 24 hpf. (a–d″) Expression of anterior forebrain markers (six3b, fgf8a, vax2) was examined by WISH in foxg1a mutants at 24 hpf, followed by genotyping. Wild-type embryos, heterozygotes, and homozygotes are shown from left to right for each gene. Asterisks indicate abnormal expression, with more asterisks indicating more severe anomalies. (a–c, a′–c′, a″–c″) Lateral views of the head. Left is anterior, top is dorsal. (d, d″, d‴) Front view of the head. Top is dorsal. In the lower right are shown the numbers of embryos with the indicated expression and the numbers of assessed embryos. ht, hypothalamus; et, epithalamus; mhb, midbrain–hindbrain boundary; poa, preoptic area; re, retina; te, telencephalon. Scale bar, 100 μm. |
|
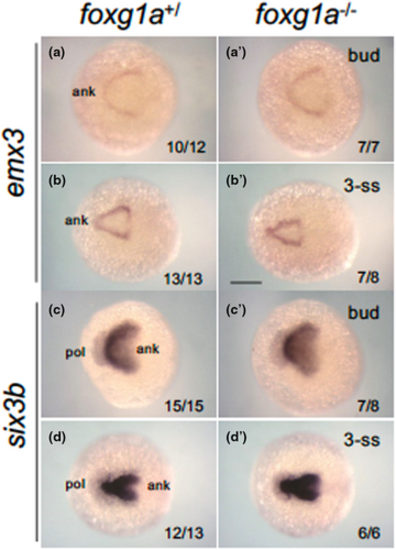
Expression of forebrain-forming genes in foxg1a mutants at the tailbud and early somitogenesis stage. Expression of anterior forebrain markers (emx3, six3b) was examined by WISH in foxg1a mutants, followed by genotyping. Wild-type embryos including heterozygotes (left) and homozygotes (right) are shown. For each gene, the upper row and bottom row show embryos at the bud stage (a, a', c, c') and the 3-ss (b, b', d, d'), respectively. Dorsal views with the anterior side to the left. In the lower right are shown the numbers of embryos with the indicated expression and the numbers of assessed embryos. ank, anterior neural keel; pol, pollster. Scale bar, 100 μm. EXPRESSION / LABELING:
|
|
Expression of genes involved in neurogenesis and Shh signaling in foxg1a mutants. The expression of neurogenesis-related genes (a–f′) and Shh signaling-related genes (g–j′) was examined by WISH in foxg1a mutants at 24 hpf, followed by genotyping. Wild-type embryos including heterozygotes (left) and homozygotes (right) are shown for each gene. Wild-type and heterozygous embryos showed indistinguishable expression patterns. Black arrowheads indicate the telencephalic ventricular zone. The numbers on the lower right indicate the numbers of embryos with the indicated expression patterns and the numbers of total assessed embryos. Asterisks indicate abnormal expression. Lateral views, anterior to the left and dorsal to the top; dorsal views, anterior to the left. et, epithalamus; fp, floor plate; ht, hypothalamus; poa, preoptic area; re, retina; te, telencephalon; tg, tegmentum; zli, zona limitans intrathalamica. Scale bar, 100 μm. |

