|
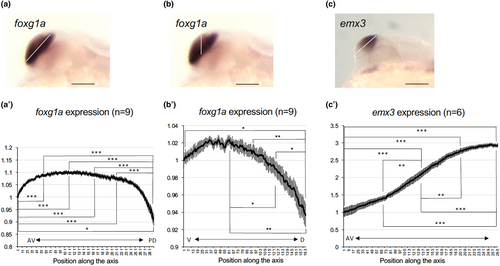
Graded expression of foxg1a and emx3 in the developing telencephalon of wild-type embryos. Expression intensity of foxg1a (a, b, a′, b′) and emx3 (c, c′) in the telencephalon was quantified at 24 hpf along its major axis (anteroventral end to posterodorsal end, white line in (a) and (c)) or vertical axis (ventral to dorsal, white line in (b)) by ImageJ (a'-c'). The staining intensities shown in the graph are the average values of nine embryos (foxg1a) or six embryos (emx3). Average values relative to those at the anteroventral/ventral-most ends are shown along the ordinate with error bars showing SEMs. The abscissa shows positions along the axis set for each quantification. AV, anteroventral; PD, posterodorsal; V, ventral; D, dorsal. *p < .05; **p < .01; ***p < .001.
|