- Title
-
Arterial-venous network formation during brain vascularization involves hemodynamic regulation of chemokine signaling
- Authors
- Bussmann, J., Wolfe, S.A., and Siekmann, A.F.
- Source
- Full text @ Development
|
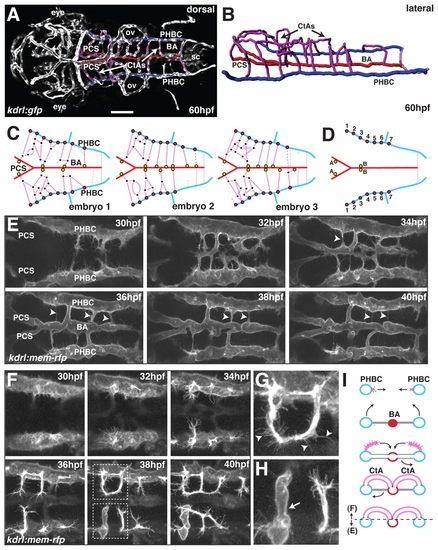
Development of the zebrafish hindbrain vasculature. (A) Maximal intensity projection of a confocal z-stack of a kdrl:gfp transgenic zebrafish brain at 60 hpf, indicating the position of the primordial hindbrain channels (PHBCs, blue), posterior communicating segments (PCSs, red), basilar artery (BA, red) and central arteries (CtAs, magenta). Dorsal view, anterior to the left. ov, otic vesicle; sc, spinal cord. Scale bar: 100 μm(B) Wire diagram of the hindbrain vasculature based on angiography at 60 hpf. Lateral oblique view. Color coding as in A. (C) Schematic representation of the hindbrain vascular network at 60 hpf in three individual wild-type (wt) embryos based on confocal z-stacks of kdrl:gfp transgenic embryos, indicating the position of PHBC-CtA connections (red filled circles), CtA-CtA connections (black dots) and CtA-BA/PCS connections (yellow filled circles). Dashed lines indicate connections without a visible lumen. Gray lines represent ventral (non-CtA) connections between the PHBC and the BA. (D) Schematic representation of stereotyped vascular connections in the hindbrain vascular network at 60 hpf. A and B, fixed CtA to BA connections; C, fixed PHBC to CtA connections. (E) Confocal time-lapse of BA formation in live kdrl:mem-rfp transgenic embryos between 30 and 40 hpf. Arrowheads indicate pruning of ventral non-CtA connections between the PHBC and the BA. (F-H) Confocal time-lapse of CtA formation in live kdrl:mem-rfp transgenic embryos. The boxed regions are enlarged in G and H, showing the presence of filopodial extensions on a non-lumenized CtA (arrowheads, G) but not on a lumenized CtA (arrow, H). (I) Schematic representation of BA and CtA formation. Transverse view. The dashed line indicates the planar level at which E and F were separated. |
|
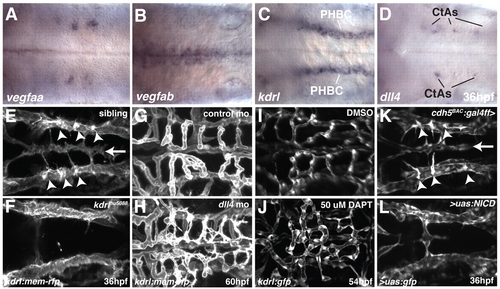
VegfA and Notch signaling are required for angiogenic sprouting in the zebrafish hindbrain. (A-D) Whole-mount in situ hybridization showing the expression of vegfaa (A), vegfab (B), kdrl (C) and dll4 (D) at 36 hpf. (E-L) Maximal intensity projections of confocal z-stacks at 36 (E,F,K,L), 54 (I,J) or 60 (G,H) hpf. Arrowheads indicate CtA sprouts emerging from the PHBC. Arrow indicates the position of the BA. (E,F) Sibling (E) or kdrl mutant (F) embryos, with endothelial cells labeled by kdrl:mem-rfp expression. (G,H) kdrl:mem-rfp-expressing embryos injected with control MO (G) or dll4 MO (H). (I,J) kdrl:gfp-expressing embryos treated from 30 to 54 hpf with DMSO (I) or DAPT (J). (K,L) Embryos from a cross between cdh5:gal4ff, uas:gfp and uas:NICD. The embryo in K is negative for uas:NICD, whereas that in L is heterozygous for uas:NICD. Endothelial cells are labeled by cdh5:gal4ff, uas:gfp expression. Dorsal views, anterior to the left. |
|
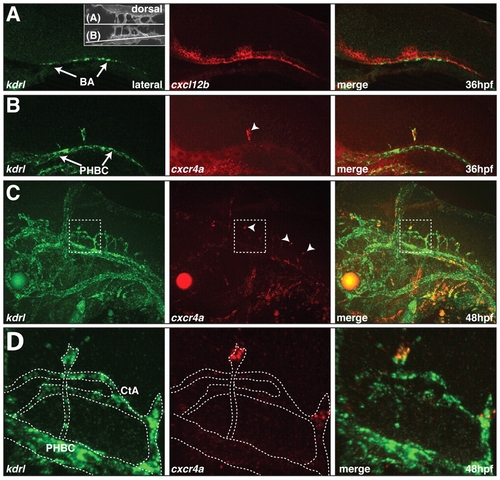
Expression of cxcl12b and cxcr4a in the zebrafish hindbrain. (A-D) Two-color fluorescent in situ hybridization showing the distribution of kdrl mRNA (green) and cxcl12b (A) and cxcr4a (B-D) mRNA (red). Lateral views, anterior to the left. (A) cxcl12b and kdrl expression at 36 hpf. Inset indicates the plane of view in A and B. (B) cxcr4a and kdrl expression at 36 hpf. Arrowhead indicates a single cxcr4a-expressing CtA sprout. (C) cxcr4a and kdrl expression at 48 hpf. Arrowheads indicate tip cells of CtA sprouts expressing cxcr4a. (D) Enlargement of the boxed area in C. The kdrl-positive endothelial cells are outlined. |
|
cxcl12b and cxcr4a are required for hindbrain vascular patterning. (A,B) Schematic representation of cxcl12b (A) and cxcr4a (B) mutant generation using zinc-finger nucleases (ZFNs). Black boxes in the gene structure represent exons and dashed lines represent introns. Yellow triangle indicates the position of the ZFN targeting site. Protein structures are displayed as red boxes. Black brackets indicate the position of conserved cysteine bridges for Cxcl12b. Black boxes in the protein structure represent the signal peptide for secretion (Cxcl12b) or membrane targeting (Cxcr4a). Gray boxes indicate the position of transmembrane helices for Cxcr4a. aa, amino acid. (C) Brightfield images of wt, cxcl12bmu100 and cxcr4aum21 homozygous mutant zebrafish at 5 dpf. (D-F) Maximal intensity projections of confocal z-stacks of kdrl:mem-rfp transgenic embryos at 60 hpf. wt (D), cxcl12bmu100 (E) and cxcr4aum21 (F) homozygous mutants are shown. Yellow arrowheads indicate CtA to BA connections; green arrowheads indicate CtA to CtA connections. (G,H) Schematic representation of the hindbrain vascular network in two individual cxcl12b mu100 (G) and cxcr4aum21 (H) homozygous mutant embryos based on confocal z-stacks of kdrl:gfp transgenic embryos. Color coding as in Fig. 1C. Gray stars indicate missing conserved vascular connections. (I-K) Quantitative analysis of hindbrain patterning in wt, cxcl12bmu100 and cxcr4aum21 homozygous mutant zebrafish. Vessel connections were counted from confocal z-stacks of kdrl:gfp transgenic embryos. **, P<0.05; n.s., not significant (Mann-Whitney U test). n=6 embryos per group. Error bars represent s.d. |
|
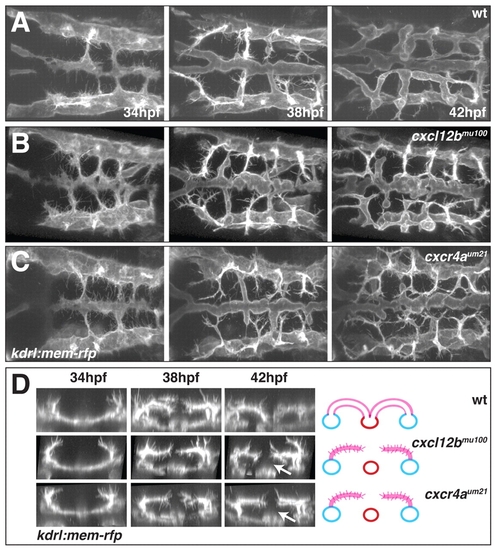
Time-lapse imaging of hindbrain vascular development in wt, cxcl12bmu100 and cxcr4aum21 mutant embryos. (A-C) Still images at 34, 38 and 42 hpf from confocal time-lapse movies of hindbrain vascular development in live wt (A), cxcl12bmu100 (B) and cxcr4aum21 (C) mutant kdrl:mem-rfp transgenic embryos (see Movies 7-9 in the supplementary material). Dorsal views, anterior to the left. (D) Transverse sections based on 3D reconstruction of the movies illustrated in A-C, highlighting the absence of ventral migration of CtA sprouts in cxcl12bmu100 and cxcr4aum21 mutant embryos (arrows). The schematic interpretations are based on 42 hpf still images as in Fig. 1I. |
|
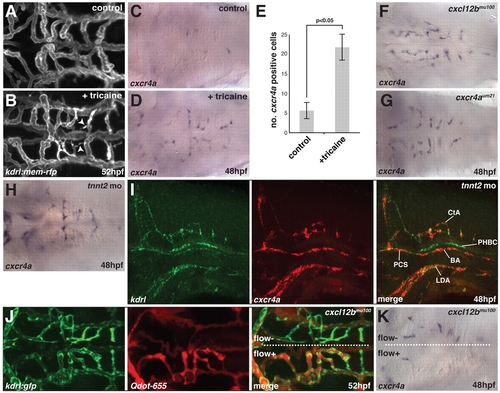
Flow is required for hindbrain vascular patterning and downregulation of cxcr4a expression. (A,B) Maximal intensity projections of confocal z-stacks of kdrl:mem-rfp transgenic zebrafish embryos at 52 hpf, untreated (A) or treated for 8 hours with 2× tricaine (B). Arrowheads indicate the presence of filopodia on non-perfused CtAs. (C,D) In situ hybridization for cxcr4a mRNA in untreated control embryos fixed at 48 hpf (C) or embryos treated for 1 hour with 2× tricaine from 47-48 hpf and fixed at 48 hpf (D). (E) Quantitative analysis of cxcr4a mRNA expression. cxcr4a-expressing cells were counted in embryos following cxcr4a in situ hybridization. P<0.05 (Mann-Whitney U test). n=15 embryos per group. Error bars represent s.d. (F-H) cxcr4a in situ hybridization in cxcl12bmu100 (F) and cxcr4aum21 (G) homozygous mutant embryos or embryos injected with 2 ng tnnt2 MO at the 1-cell stage (H) and fixed at 48 hpf. (I) Two-color fluorescent in situ hybridization of embryos injected with 2 ng tnnt2 MO and fixed at 48 hpf, showing the distribution cxcr4a mRNA (red) and kdrl mRNA (green). (J) Angiography using Quantum dots (Qdot-655; Invitrogen) in a kdrl:gfp transgenic, cxcl12bmu100 homozygous mutant embryo at 52 hpf. In this embryo, only one half of the brain had perfused CtAs (flow+ versus flow). (K) In situ hybridization for cxcr4a mRNA in a cxcl12bmu100 homozygous mutant embryo in which half of the hindbrain contained perfused CtAs at 48 hpf. Dorsal views, anterior to the left, except in I, which is a side view with anterior to the left. |
|
Loss of filopodia after onset of vessel perfusion. Consecutive frames from a confocal time-lapse movie of CtA formation in live kdrl:mem-rfp transgenic zebrafish embryos, 36-46 hpf (see Movie 4 in the supplementary material). The boxed area in the first frame indicates the region of imaging. Frames start at around 40 hpf (3:55 after the onset of imaging). Arrowheads indicate individual filopodia that disappear within 10 minutes after the onset of vessel perfusion. |
|
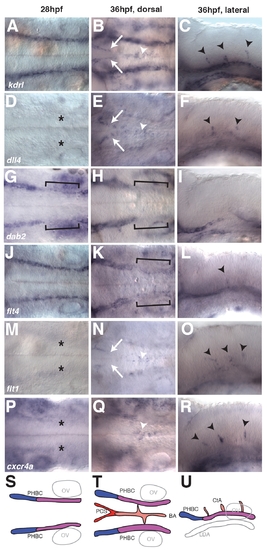
Arterial and venous marker gene expression in the zebrafish hindbrain. (A-R) Whole-mount in situ hybridization showing the distribution of kdrl (A-C), dll4 (D-F), dab2 (G-I), flt4 (J-L), flt1 (M-O) and cxcr4a (P-R) prior to (28 hpf, first column) and during (36 hpf, second and third columns) angiogenic sprouting from the PHBC. For visualization of gene expression in the BA at 36 hpf, an optical section recorded from the dorsal side at the level of the BA and PHBC is displayed (second column). For visualization of gene expression in the CtA sprouts, an optical section recorded from the lateral side at the level of the BA is displayed (third column). Black asterisks indicate absence of dll4 (D), flt1 (M) and cxcr4a (P) expression in the PHBC at 28 hpf. White arrows indicate presence of kdrl (B), dll4 (E) and flt1 (N) expression in the PCS at 36 hpf. White arrowheads indicate presence of kdrl (B), dll4 (E), flt1 (N) and cxcr4a (Q) expression in the BA at 36 hpf. Brackets indicate lower dab2 (G,H) and flt4 (K) expression in the posterior PHBCs. Black arrowheads indicate presence of kdrl (C), dll4 (F), flt4 (L), flt1 (O) and cxcr4a (R) in CtA sprouts. (S-U) Schematic representation of gene expression domains during hindbrain angiogenesis. Four domains were identified: the anterior PHBC expressing high levels of flt4 and dab2 (blue); the posterior PHBC expressing low levels of dab2 at 28 hpf and flt4 and dab2 at 36 hpf (purple); the BA in addition to the CtA sprouts expressing flt1, dll4, flt4 and cxcr4a (pink); and the PCS expressing flt1 and dll4 but not cxcr4a (red). |
|
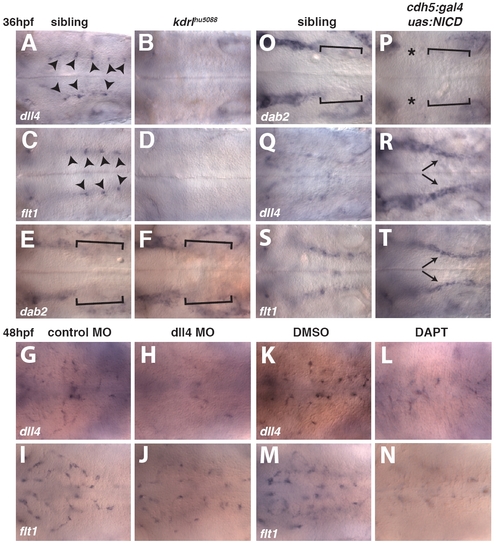
Gene expression changes in kdrlhθ5088 mutant embryos and embryos with increased or decreased Notch signaling pathway activation. (A-F) Whole-mount in situ hybridization showing the expression of dll4 (A,B), flt1 (C,D) and dab2 (E,F) at 36 hpf in sibling control (A,C,E) and kdrlhu5088 mutant (B,D,F) embryos. Optical section dorsal to the PHBC (A-D) or at the level of the PHBC (E,F). Arrowheads indicate dll4 (A) and flt1 (C) expression in CtA sprouts. Brackets indicate reduced expression of dab2 in the posterior PHBC (E,F). (G-J) Whole-mount in situ hybridization showing the expression of dll4 (G,H) or flt1 (I,J) in control MO-injected (G,I) or dll4 MO-injected (H,J) embryos. (K-N) Whole-mount in situ hybridization showing the expression of dll4 (K,L) or flt1 (M,N) in embryos treated with 0.2% DMSO between 30 hpf and 48 hpf (K,M) and embryos treated with 50 μM DAPT between 30 hpf and 48 hpf (L,N). (O-T) Whole-mount in situ hybridization showing the distribution of dab2 (O,P), dll4 (Q,R) and flt1 (S,T) in sibling (O,Q,S) or cdh5:gal4ff; uas:NICD double-transgenic (P,R,T) embryos at 36 hpf, optical sections at the level of the PHBC. Brackets indicate reduced expression of dab2 in the posterior PHBC (O,P). Asterisks mark reduced dab2 expression in the anterior PHBCs in cdh5:gal4ff; uas:NICD double-transgenic embryos (P). Arrows indicate ectopic expression of dll4 (R) and flt1 (T) throughout the PHBC in cdh5:gal4ff; uas:NICD double-transgenic embryos. |
|
Hindbrain vascular network quantification. (A-I) Hindbrain vascular network quantification for kdrlhu5088 mutant (A-C), dll4 MO-injected (D-F) and cdh5:gal4ff; uas:NICD double-transgenic embryos (G-I) at 60 hpf. (A,B) Maximal intensity projections of confocal z-stacks of kdrl:mem-rfp; fli1a:nuc-gfp double-transgenic embryos of siblings (A) or homozygous mutant for the kdrlhu5088 allele (B) at 60 hpf; dorsal view, anterior to the left. (C) Quantification of various network parameters, such as the number of connections between PHBCs, CtAs and BA in addition to the cell numbers in these vessels for sibling embryos versus kdrlhu5088 mutants at 60 hpf. Confocal z-stacks of kdrl:mem-rfp or kdrl:mem-rfp; fli1a:nuc-gfp double-transgenic embryos were analyzed. Circles represent individual embryos, black lines indicate the mean value. **, P<0.01; *, P<0.05; N.S., P>0.05; Mann-Whitney test. (D,E) Projection as in A,B of embryos injected with 10 ng control MO (D) or dll4 MO (E) at 60 hpf. (F) Quantification of various network parameters as in C for dll4 MO-injected versus control MO-injected embryos at 60 hpf. (G,H) Projection as in A and B of siblings (G) or cdh5:gal4ff, uas:NICD double-transgenic embryos (H) at 60 hpf. (I) Quantification of various network parameters as in C for cdh5:gal4ff, uas:NICD double-transgenic versus sibling embryos at 60 hpf. |
|
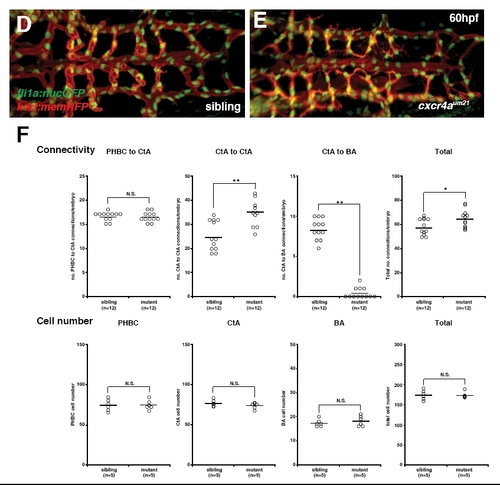
Hindbrain vascular network quantification for cxcl12bmθ100 and cxcr4aθm21 mutant embryos at 60 hpf. (A,B) Maximal intensity projections of confocal z-stacks of kdrl:mem-rfp; fli1a:nuc-gfp double-transgenic embryos of siblings (A) or homozygous mutant for the cxcl12bmu100 allele (B) at 60 hpf; dorsal view, anterior to the left. (C) Quantification of various network parameters, such as the number of connections between PHBCs, CtAs and BA in addition to the cell numbers in these vessels for cxcl12bmu100 siblings versus mutants at 60 hpf. Confocal z-stacks of kdrl:mem-rfp or kdrl:mem-rfp; fli1a:nuc-gfp double-transgenic embryos were analyzed. Circles represent individual embryos, black lines indicate the mean value. **, P<0.01; *, P<0.05; N.S., P>0.05; Mann-Whitney test. (D,E) Projection as in A and B of siblings (D) or homozygous mutant embryos for the cxcr4aum21 allele (E) at 60 hpf. (F) Quantification of various network parameters as in C for sibling embryos versus cxcr4aum21 mutants at 60 hpf. |
|
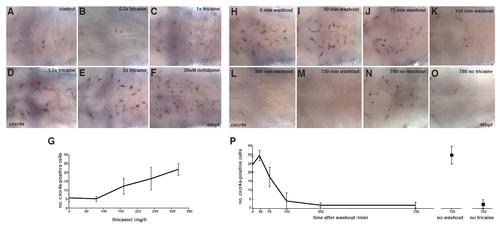
Flow regulation of cxcr4a expression. (A-F) In situ hybridization to visualize cxcr4a mRNA expression of untreated embryos (A) or embryos treated for 1 hour (47-48 hpf) with increasing doses of tricaine (1× tricaine is 168 mg/l, the standard dose for zebrafish anesthesia) (B-E) or 20 μM nifedipine (F). (G) Quantification of cxcr4a-expressing cells in the hindbrain; the total number of cxcr4a-expressing cells based on in situ hybridization in the hindbrain was counted. Error bars represent s.d. (H-O) Tricaine washout. In situ hybridization of embryos treated for 1 hour from 48 hours with 2× tricaine (336 mg/l) fixed at various times after drug washout (H-M), embryos treated for 13 hours with 2× tricaine (N), or untreated embryos fixed at 61 hpf (O) used as control. (P) Quantification of cxcr4a-expressing cells in the hindbrain; the total number of cxcr4a-expressing cells based on in situ hybridization in the hindbrain was counted. Error bars represent s.d. |
|
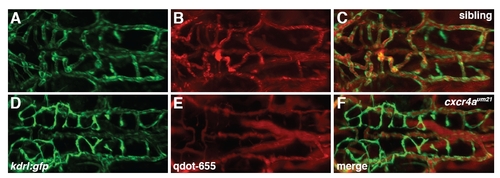
Angiography of cxcr4aθm21 mutant embryos at 60 hpf showing absence of CtA perfusion. Maximal projection of confocal z-stacks of kdrl:gfp transgenic embryos injected with 655 nm emission Quantum dots (Qdot-655) to label perfused vessels. (A-C) Sibling embryo. (D-F) cxcr4aum21 homozygous mutant embryo. |
|
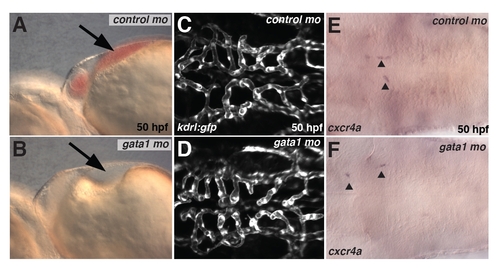
Loss of erythrocytes does not affect hindbrain vascular patterning. (A,B) Brightfield image of embryos injected with control MO (A) or gata1 MO (B) at 50 hpf. Note the absence of erythrocytes in the heart region in gata1 MO-injected but not control MO-injected embryos (arrow). (C,D) Maximum projections of confocal z-stacks of kdrl:gfp transgenic embryos at 50 hpf injected with control MO (C) or gata1 MO (D) at 50 hpf. (E,F) Expression of cxcr4a in control MO-injected embryos (E) and gata1 MO-injected embryos (F). |

