
Fig. S5
- ID
- ZDB-FIG-110428-20
- Publication
- Bussmann et al., 2011 - Arterial-venous network formation during brain vascularization involves hemodynamic regulation of chemokine signaling
- Other Figures
- All Figure Page
- Back to All Figure Page
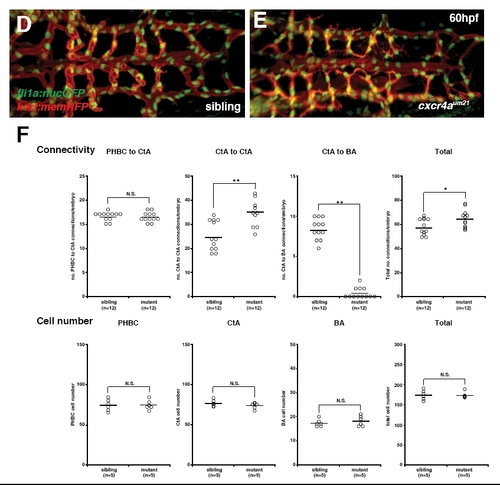
Hindbrain vascular network quantification for cxcl12bmθ100 and cxcr4aθm21 mutant embryos at 60 hpf. (A,B) Maximal intensity projections of confocal z-stacks of kdrl:mem-rfp; fli1a:nuc-gfp double-transgenic embryos of siblings (A) or homozygous mutant for the cxcl12bmu100 allele (B) at 60 hpf; dorsal view, anterior to the left. (C) Quantification of various network parameters, such as the number of connections between PHBCs, CtAs and BA in addition to the cell numbers in these vessels for cxcl12bmu100 siblings versus mutants at 60 hpf. Confocal z-stacks of kdrl:mem-rfp or kdrl:mem-rfp; fli1a:nuc-gfp double-transgenic embryos were analyzed. Circles represent individual embryos, black lines indicate the mean value. **, P<0.01; *, P<0.05; N.S., P>0.05; Mann-Whitney test. (D,E) Projection as in A and B of siblings (D) or homozygous mutant embryos for the cxcr4aum21 allele (E) at 60 hpf. (F) Quantification of various network parameters as in C for sibling embryos versus cxcr4aum21 mutants at 60 hpf. |