
Fig. S4
- ID
- ZDB-IMAGE-110428-16
- Publication
- Bussmann et al., 2011 - Arterial-venous network formation during brain vascularization involves hemodynamic regulation of chemokine signaling
- All Figures
- Figures for Bussmann et al., 2011
|
Fig. S4
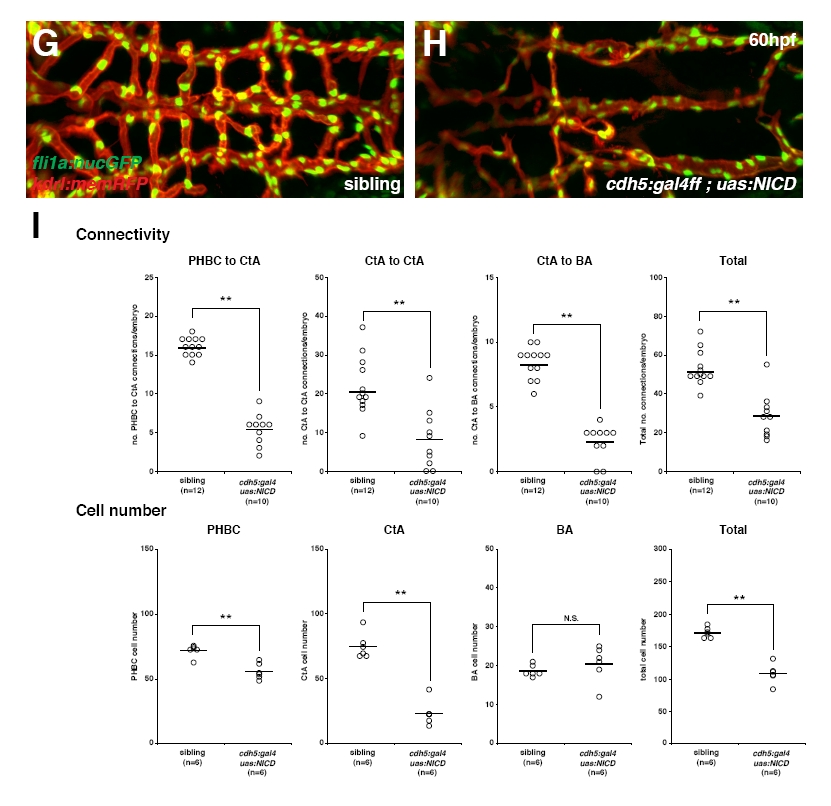
Hindbrain vascular network quantification. (A-I) Hindbrain vascular network quantification for kdrlhu5088 mutant (A-C), dll4 MO-injected (D-F) and cdh5:gal4ff; uas:NICD double-transgenic embryos (G-I) at 60 hpf. (A,B) Maximal intensity projections of confocal z-stacks of kdrl:mem-rfp; fli1a:nuc-gfp double-transgenic embryos of siblings (A) or homozygous mutant for the kdrlhu5088 allele (B) at 60 hpf; dorsal view, anterior to the left. (C) Quantification of various network parameters, such as the number of connections between PHBCs, CtAs and BA in addition to the cell numbers in these vessels for sibling embryos versus kdrlhu5088 mutants at 60 hpf. Confocal z-stacks of kdrl:mem-rfp or kdrl:mem-rfp; fli1a:nuc-gfp double-transgenic embryos were analyzed. Circles represent individual embryos, black lines indicate the mean value. **, P<0.01; *, P<0.05; N.S., P>0.05; Mann-Whitney test. (D,E) Projection as in A,B of embryos injected with 10 ng control MO (D) or dll4 MO (E) at 60 hpf. (F) Quantification of various network parameters as in C for dll4 MO-injected versus control MO-injected embryos at 60 hpf. (G,H) Projection as in A and B of siblings (G) or cdh5:gal4ff, uas:NICD double-transgenic embryos (H) at 60 hpf. (I) Quantification of various network parameters as in C for cdh5:gal4ff, uas:NICD double-transgenic versus sibling embryos at 60 hpf.