
IMAGE
Fig. S1
- ID
- ZDB-IMAGE-110428-21
- Publication
- Bussmann et al., 2011 - Arterial-venous network formation during brain vascularization involves hemodynamic regulation of chemokine signaling
- All Figures
- Figures for Bussmann et al., 2011
Image
|
Figure Caption
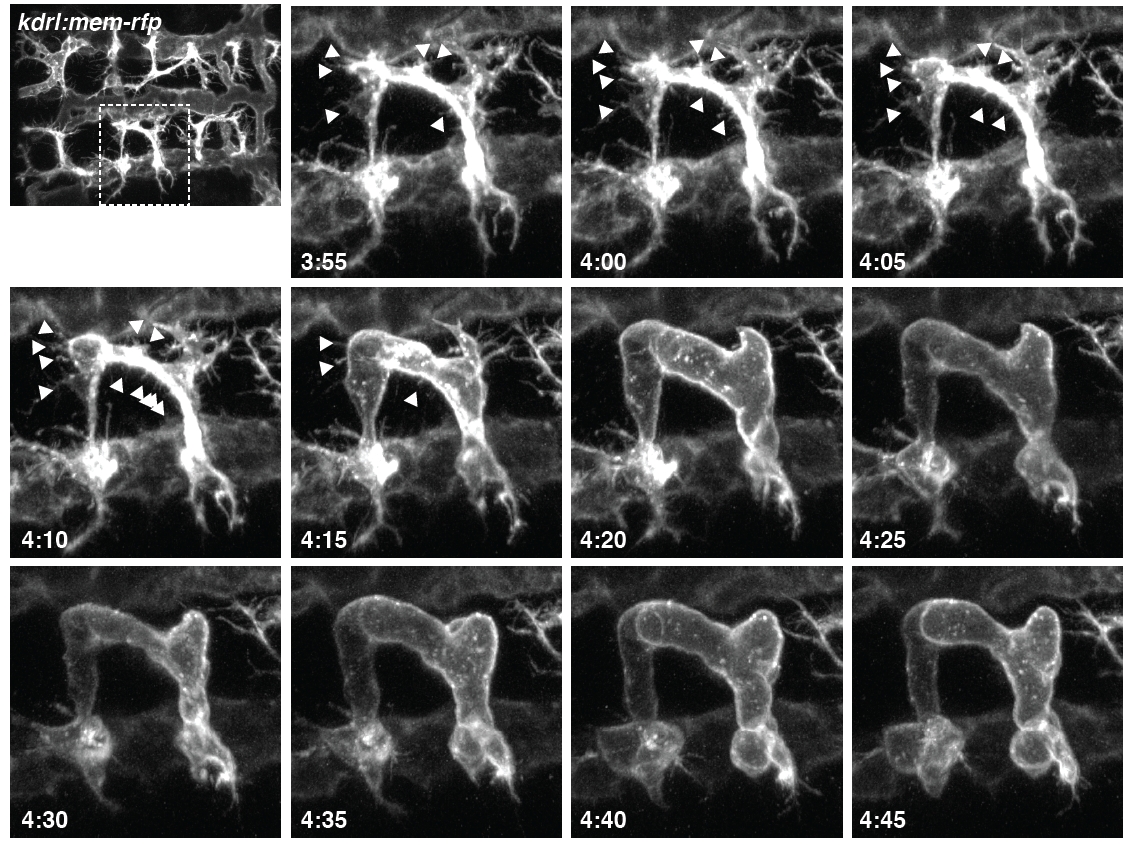
Fig. S1
Loss of filopodia after onset of vessel perfusion. Consecutive frames from a confocal time-lapse movie of CtA formation in live kdrl:mem-rfp transgenic zebrafish embryos, 36-46 hpf (see Movie 4 in the supplementary material). The boxed area in the first frame indicates the region of imaging. Frames start at around 40 hpf (3:55 after the onset of imaging). Arrowheads indicate individual filopodia that disappear within 10 minutes after the onset of vessel perfusion.
Acknowledgments
This image is the copyrighted work of the attributed author or publisher, and
ZFIN has permission only to display this image to its users.
Additional permissions should be obtained from the applicable author or publisher of the image.
Full text @ Development