
Fig. S6
- ID
- ZDB-IMAGE-110428-18
- Publication
- Bussmann et al., 2011 - Arterial-venous network formation during brain vascularization involves hemodynamic regulation of chemokine signaling
- All Figures
- Figures for Bussmann et al., 2011
|
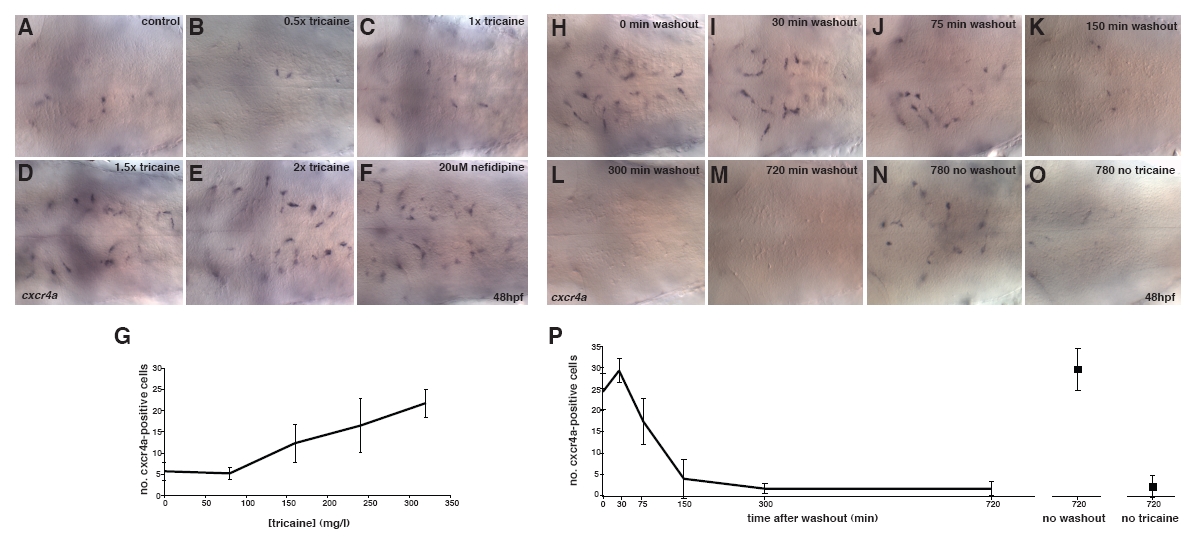
Fig. S6
Flow regulation of cxcr4a expression. (A-F) In situ hybridization to visualize cxcr4a mRNA expression of untreated embryos (A) or embryos treated for 1 hour (47-48 hpf) with increasing doses of tricaine (1× tricaine is 168 mg/l, the standard dose for zebrafish anesthesia) (B-E) or 20 μM nifedipine (F). (G) Quantification of cxcr4a-expressing cells in the hindbrain; the total number of cxcr4a-expressing cells based on in situ hybridization in the hindbrain was counted. Error bars represent s.d. (H-O) Tricaine washout. In situ hybridization of embryos treated for 1 hour from 48 hours with 2× tricaine (336 mg/l) fixed at various times after drug washout (H-M), embryos treated for 13 hours with 2× tricaine (N), or untreated embryos fixed at 61 hpf (O) used as control. (P) Quantification of cxcr4a-expressing cells in the hindbrain; the total number of cxcr4a-expressing cells based on in situ hybridization in the hindbrain was counted. Error bars represent s.d.