Fig. 1
- ID
- ZDB-FIG-110428-10
- Publication
- Bussmann et al., 2011 - Arterial-venous network formation during brain vascularization involves hemodynamic regulation of chemokine signaling
- Other Figures
- All Figure Page
- Back to All Figure Page
|
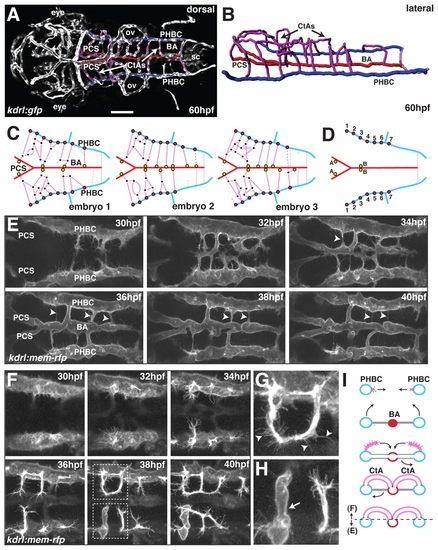
Development of the zebrafish hindbrain vasculature. (A) Maximal intensity projection of a confocal z-stack of a kdrl:gfp transgenic zebrafish brain at 60 hpf, indicating the position of the primordial hindbrain channels (PHBCs, blue), posterior communicating segments (PCSs, red), basilar artery (BA, red) and central arteries (CtAs, magenta). Dorsal view, anterior to the left. ov, otic vesicle; sc, spinal cord. Scale bar: 100 μm(B) Wire diagram of the hindbrain vasculature based on angiography at 60 hpf. Lateral oblique view. Color coding as in A. (C) Schematic representation of the hindbrain vascular network at 60 hpf in three individual wild-type (wt) embryos based on confocal z-stacks of kdrl:gfp transgenic embryos, indicating the position of PHBC-CtA connections (red filled circles), CtA-CtA connections (black dots) and CtA-BA/PCS connections (yellow filled circles). Dashed lines indicate connections without a visible lumen. Gray lines represent ventral (non-CtA) connections between the PHBC and the BA. (D) Schematic representation of stereotyped vascular connections in the hindbrain vascular network at 60 hpf. A and B, fixed CtA to BA connections; C, fixed PHBC to CtA connections. (E) Confocal time-lapse of BA formation in live kdrl:mem-rfp transgenic embryos between 30 and 40 hpf. Arrowheads indicate pruning of ventral non-CtA connections between the PHBC and the BA. (F-H) Confocal time-lapse of CtA formation in live kdrl:mem-rfp transgenic embryos. The boxed regions are enlarged in G and H, showing the presence of filopodial extensions on a non-lumenized CtA (arrowheads, G) but not on a lumenized CtA (arrow, H). (I) Schematic representation of BA and CtA formation. Transverse view. The dashed line indicates the planar level at which E and F were separated. |
| Genes: | |
|---|---|
| Fish: | |
| Anatomical Terms: | |
| Stage Range: | Prim-15 to Pec-fin |

