
Fig. 6
- ID
- ZDB-IMAGE-110428-13
- Genes
- Publication
- Bussmann et al., 2011 - Arterial-venous network formation during brain vascularization involves hemodynamic regulation of chemokine signaling
- All Figures
- Figures for Bussmann et al., 2011
|
Fig. 6
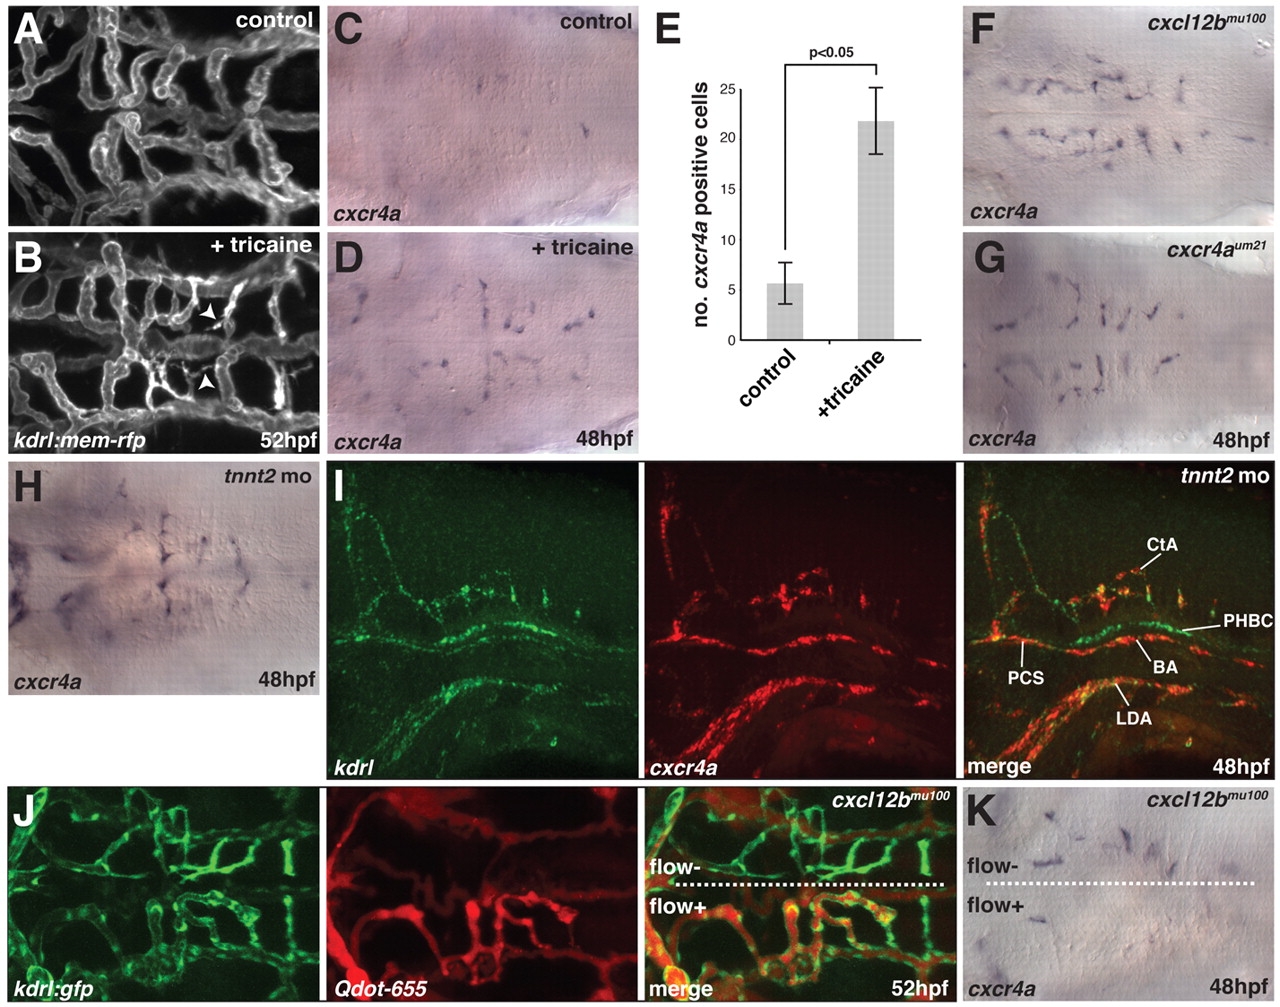
Flow is required for hindbrain vascular patterning and downregulation of cxcr4a expression. (A,B) Maximal intensity projections of confocal z-stacks of kdrl:mem-rfp transgenic zebrafish embryos at 52 hpf, untreated (A) or treated for 8 hours with 2× tricaine (B). Arrowheads indicate the presence of filopodia on non-perfused CtAs. (C,D) In situ hybridization for cxcr4a mRNA in untreated control embryos fixed at 48 hpf (C) or embryos treated for 1 hour with 2× tricaine from 47-48 hpf and fixed at 48 hpf (D). (E) Quantitative analysis of cxcr4a mRNA expression. cxcr4a-expressing cells were counted in embryos following cxcr4a in situ hybridization. P<0.05 (Mann-Whitney U test). n=15 embryos per group. Error bars represent s.d. (F-H) cxcr4a in situ hybridization in cxcl12bmu100 (F) and cxcr4aum21 (G) homozygous mutant embryos or embryos injected with 2 ng tnnt2 MO at the 1-cell stage (H) and fixed at 48 hpf. (I) Two-color fluorescent in situ hybridization of embryos injected with 2 ng tnnt2 MO and fixed at 48 hpf, showing the distribution cxcr4a mRNA (red) and kdrl mRNA (green). (J) Angiography using Quantum dots (Qdot-655; Invitrogen) in a kdrl:gfp transgenic, cxcl12bmu100 homozygous mutant embryo at 52 hpf. In this embryo, only one half of the brain had perfused CtAs (flow+ versus flow). (K) In situ hybridization for cxcr4a mRNA in a cxcl12bmu100 homozygous mutant embryo in which half of the hindbrain contained perfused CtAs at 48 hpf. Dorsal views, anterior to the left, except in I, which is a side view with anterior to the left.