
Fig. S2
- ID
- ZDB-IMAGE-110428-14
- Publication
- Bussmann et al., 2011 - Arterial-venous network formation during brain vascularization involves hemodynamic regulation of chemokine signaling
- All Figures
- Figures for Bussmann et al., 2011
|
Fig. S2
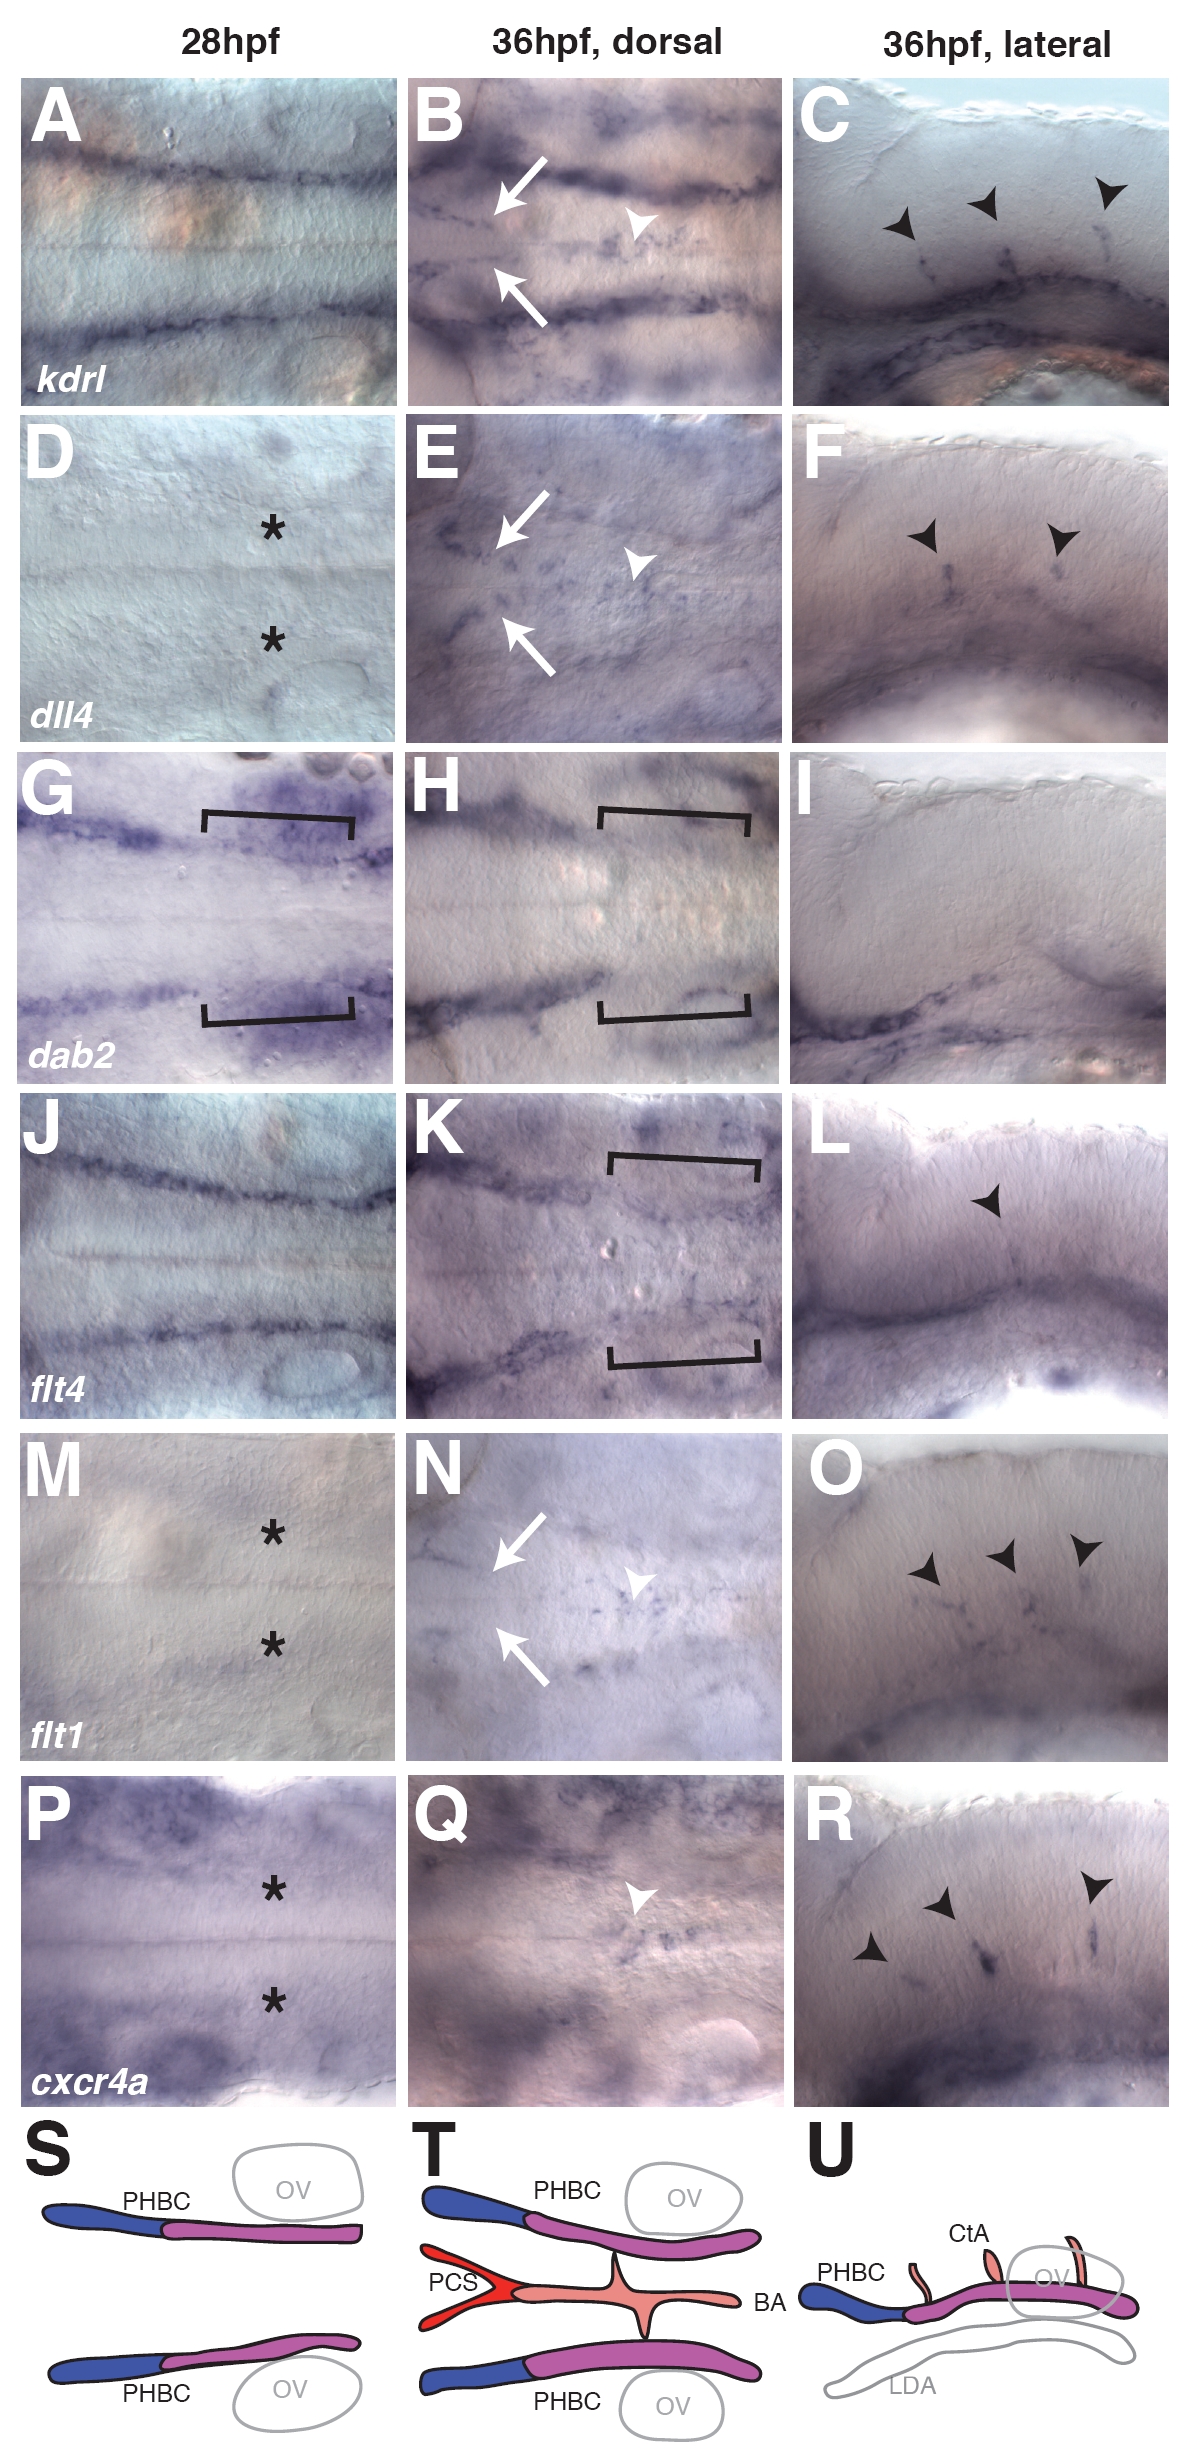
Arterial and venous marker gene expression in the zebrafish hindbrain. (A-R) Whole-mount in situ hybridization showing the distribution of kdrl (A-C), dll4 (D-F), dab2 (G-I), flt4 (J-L), flt1 (M-O) and cxcr4a (P-R) prior to (28 hpf, first column) and during (36 hpf, second and third columns) angiogenic sprouting from the PHBC. For visualization of gene expression in the BA at 36 hpf, an optical section recorded from the dorsal side at the level of the BA and PHBC is displayed (second column). For visualization of gene expression in the CtA sprouts, an optical section recorded from the lateral side at the level of the BA is displayed (third column). Black asterisks indicate absence of dll4 (D), flt1 (M) and cxcr4a (P) expression in the PHBC at 28 hpf. White arrows indicate presence of kdrl (B), dll4 (E) and flt1 (N) expression in the PCS at 36 hpf. White arrowheads indicate presence of kdrl (B), dll4 (E), flt1 (N) and cxcr4a (Q) expression in the BA at 36 hpf. Brackets indicate lower dab2 (G,H) and flt4 (K) expression in the posterior PHBCs. Black arrowheads indicate presence of kdrl (C), dll4 (F), flt4 (L), flt1 (O) and cxcr4a (R) in CtA sprouts. (S-U) Schematic representation of gene expression domains during hindbrain angiogenesis. Four domains were identified: the anterior PHBC expressing high levels of flt4 and dab2 (blue); the posterior PHBC expressing low levels of dab2 at 28 hpf and flt4 and dab2 at 36 hpf (purple); the BA in addition to the CtA sprouts expressing flt1, dll4, flt4 and cxcr4a (pink); and the PCS expressing flt1 and dll4 but not cxcr4a (red).