
- Title
-
Setdb2 restricts dorsal organizer territory and regulates left-right asymmetry through suppressing fgf8 activity
- Authors
- Xu, P.F., Zhu, K.Y., Jin, Y., Chen, Y., Sun, X.J., Deng, M., Chen, S.J., Chen, Z., and Liu, T.X.
- Source
- Full text @ Proc. Natl. Acad. Sci. USA
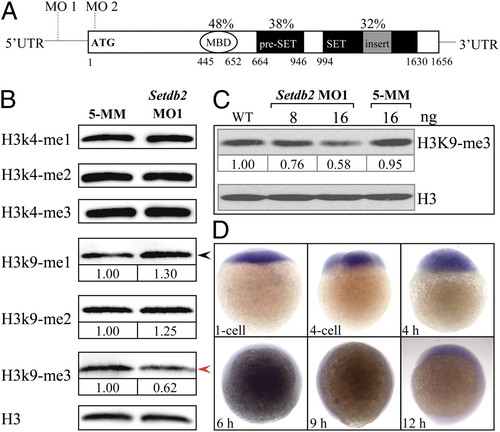
Setdb2 is a maternally expressed gene in zebrafish and possesses H3K9me3 activity in vivo. (A) Evolutionarily conserved domain architecture of zebrafish Setdb2 protein. The Setdb2 protein is composed of a methylated DNA binding domain (MBD), a pre-SET domain, and a bifurcated SET domain. The MO1 and MO2 indicate the positions of sequences targeted by the morpholino oligonucleotides. The percentages indicate the amino acid identities between human and zebrafish Setdb2. The Arabic numbers denote the position of each domain. (B) Western blot analyses of histone methylation levels in the control and the Setdb2-deficient embryos at 10 hpf. Red and black arrows denote a reduction and an increase of the level of H3K9me3 and H3K9me1, respectively. (C) Dose-dependent reduction of H3K9me3 level in the embryos injected with indicated amounts of setdb2 morpholino. (D) Spatial and temporary expression of setdb2 during early embryonic development. The Arabic numbers at the Bottom denote the extent of methylation modification compared with histone H3 level by densitometry. EXPRESSION / LABELING:
PHENOTYPE:
|

Organ laterality is randomized in setdb2-knockdown embryos. (A?L) Whole-mount mRNA in situ hybridization and statistical analyses of visceral and diencephalic laterality in the 5-MM control and setdb2 MO2-injected embryos at the indicated developmental stages with probes cmlc2 (A?C), lefty1 (D?F), cebpα (G?I, arrows), and insulin (J?L). (M?O) Determination of pancreatic laterality in 72-hpf Tg(insulin:EGFP) transgenic embryos injected with 5-MM control and setdb2 MO2. Dashed lines denote the embryonic midline. LV, liver; G, gut; L, Left side; R, Right side; C/B, central or bilateral; A, absent. All embryos are dorsal views with head to the top. EXPRESSION / LABELING:
PHENOTYPE:
|
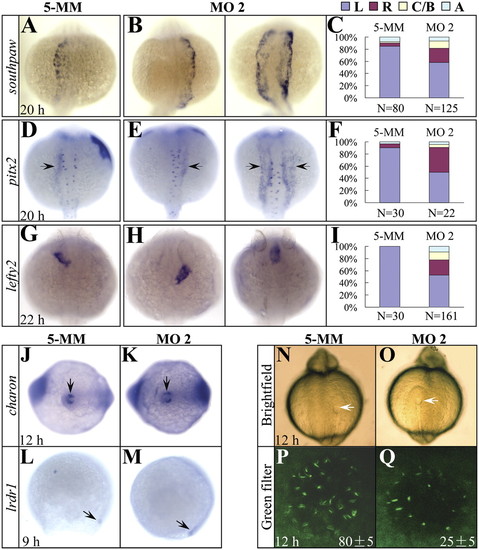
The expression of asymmetric genes is randomized and cilia development in the Kupffer?s vesicle is disrupted in setdb2-knockdown embryos. (A?I) Whole-mount mRNA in situ hybridization and statistical analyses of the expression of asymmetric genes southpaw (A?C), pitx2 (D?F, arrows), and lefty2 (G?I) in the 5-MM control and setdb2 MO2-injected embryos at the indicated developmental stages. L, Left side; R, Right side; C/B, central or bilateral; A, absent. All embryos are dorsal views with head to the top. (J?M) WISH analyses of charon (J and K, arrows) and lrdr1 expression (L and M, arrows) in the 5-MM control and setdb2 MO2-injected embryos. (N?Q) Morphology of Kupffer?s vesicle (N and O, arrows) and confocol analyses of ciliary development (P and Q, green) as revealed by immunostaining with anti-acetylated tubulin antibody. The numbers in P and Q denote the mean ± SD. Embryos are ventral views in J, K, N, and O and lateral views in L and M. EXPRESSION / LABELING:
PHENOTYPE:
|
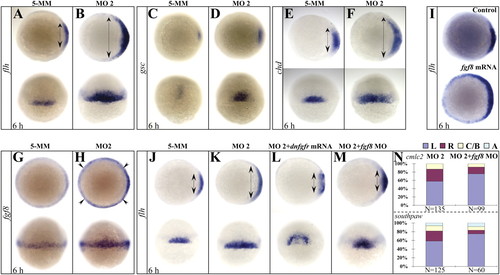
Setdb2 restricts dorsal organizer formation and regulates left?right asymmetry through suppressing Fgf8 activity. (A?F) WISH analyses of organizer markers flh (A and B), gsc (C and D), and chd (E and F) in the 5-MM control and setdb2 MO2-injected embryos at 6 hpf. Double-headed arrows denote territories of dorsal organizer. Embryos are animal views in the Upper panels, dorsal views in the Bottom panels. (G?I) WISH analyses of fgf8 expression (G and H) in the 5-MM control and setdb2 MO2-injected embryos at 6 hpf and effects of fgf8 overexpression on the dorsal organizer development as revealed by flh expression (I). Embryos are animal views in panels G and H (Upper) and I and dorsal views in panels G and H (Bottom). (J?M) WISH analyses of flh in the 6-hpf embryos injected with 5-MM control (J), setdb2 MO2 (K), setdb2 MO2 plus dominant-negative fibroblast growth factor receptor (dnfgfr) mRNAs (L), and setdb2 MO2 plus fgf8 morpholino oligonucleotides (M). (N) Statistic analyses of heart laterality marker cmlc2 and asymmetric gene southpaw in 6-hpf embryos injected with setdb2 MO2 and setdb2 MO2 plus fgf8 morpholino. Embryos are animal views in the Upper Panels and dorsal views in the Lower Panels. |
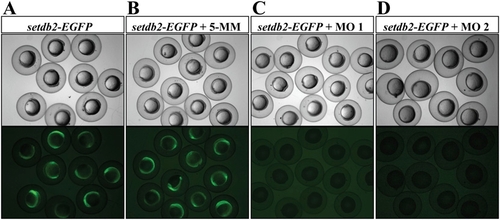
Efficiency and specificity of setdb2 morpholino oligonucleotides. (A?D) Light and fluorescent images of 12-hpf embryos injected with a reporter EGFP mRNA alone (A), a reporter EGFP mRNA plus 5-MM control morpholino (B), a reporter EFGP mRNA plus either setdb2 MO1 (C), or setdb2 MO2 (D). The sequence of partial 5′-UTR plus 177 bp immediately downstream of setdb2 ATG was fused to the ATG-deleted ORF of the EGFP gene as a reporter to test the knockdown efficiency and specificity of setdb2 morpholinos. |
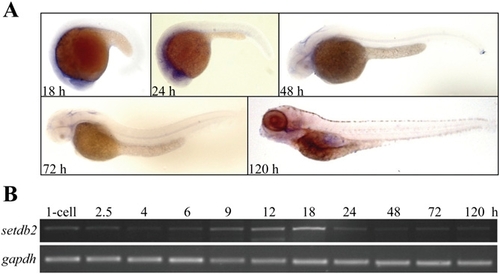
Spatial and temporary expression of setdb2 during embryogenesis. (A) Whole-mount in situ hybridization analyses of setdb2 expression patterns at the indicated developmental stages. Embryos are lateral view with head to the left. (B) Semiquantitative RT-PCR analyses of setdb2 expression at the indicted developmental stages with gapdh as an internal control. |
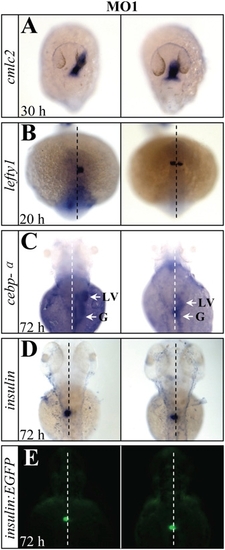
Organ laterality is randomized in setdb2-knockdown embryos with MO1. (A?D) Whole-mount mRNA in situ hybridization of visceral and diencephalic laterality in the setdb2 MO1-injected embryos at the indicated developmental stages with probes cmlc2 (A), lefty1 (B), cebpα (C, arrows), and insulin (D). (E) Determination of pancreatic laterality in 72-hpf Tg(insulin:EGFP) transgenic embryos injected with setdb2 MO1. Dashed lines denote the embryonic midline. LV, liver; G, gut. All embryos are dorsal views with head to the top. EXPRESSION / LABELING:
PHENOTYPE:
|
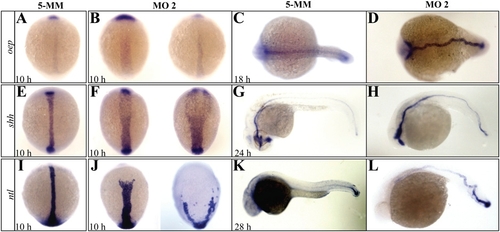
Defective midline development in setdb2-knockdown embryos. (A?L) Whole-mount in situ hybridization analyses of midline markers oep (A?D), shh (E?H), and ntl (I?L) in the 5-MM control and setdb2 MO2-injected embryos at the indicated developmental stages. Embryos are dorsal views with head to the top in panels A, B, E, F, I, and J and to the left in panels C and D. Lateral views with head to the left in panels G, H, K, and L. |
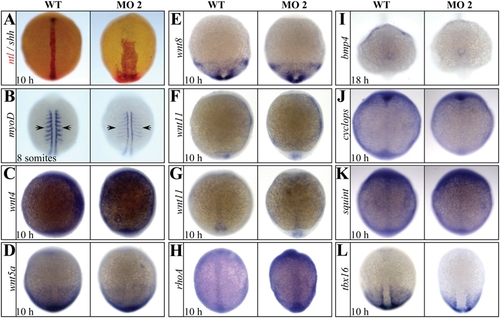
The expression of components of noncanonical Wnt and TGF-β signaling transduction pathway and T-box gene family were not affected in setdb2- knockdown embryos. (A) Double in situ hybridization analyses of ntl (red) and shh (black) in the 10-hpf embryos injected with 5-MM control and setdb2 MO2. (B?L) Whole-mount in situ hybridization analyses of myod (B), wnt4 (C), wnt5a (D), wnt8 (E), wnt11 (F, lateral view), wnt11 (G, dorsal view), rhoA (H), bmp4 (I), cyclops (J), squint (K), and tbx16 (L) in the 10-hpf embryos injected with 5-MM control and setdb2 MO2. Embyros are dorsal views in panels A?E and G?L, and lateral views in panel F. |
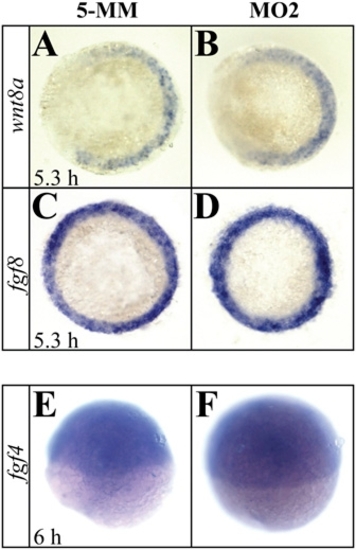
Earlier stages of gastrulation and expression of fgf4 is not affected in setdb2-knockdown embryos. (A?D) Whole-mount in situ hybridization analyses of the expression of wnt8a and fgf8 in the 5-MM control and setdb2 MO2-injected embryos at 5.3 hpf. Embryos are shown as animal views. (E and F) Wholemount in situ hybridization analyses of the expression of fgf4 in the 5-MM control and setdb2 MO2-injected embryos at 6 hpf. Embryos are lateral views with animal pole to the top. |
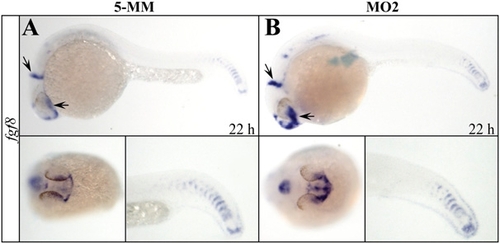
Expression of fgf8 is increased in setdb2-knockdown embryos at 22 hpf. (A and B) Whole-mount in situ hybridization analyses of fgf8 expression in the 22-hpf embryos injected with 5-MM control and setdb2 MO2. Embryos are lateral views with head to the left in the Upper Panels, anterior-ventral views in the Lower Left Panels, and posterior-lateral views in the Lower Right Panels. |