
- Title
-
Leukocyte invasion of the brain after peripheral trauma in zebrafish (Danio rerio)
- Authors
- Chen, X.K., Kwan, J.S., Wong, G.T., Yi, Z.N., Ma, A.C., Chang, R.C.
- Source
- Full text @ Exp. Mol. Med.

a Experimental setup. dpf, day post-fertilization. b–d Light-sheet imaging showed a significantly increased number of coro1a + leukocytes in the zebrafish whole brain/midbrain and forebrain with peripheral trauma (PT) at 1 day post-trauma (dpt) but not at 2 dpt compared with the control (CTRL). Independent t test, **, p < 0.01. Scale bar, 40 µm (whole brain), 20 µm (forebrain). f forebrain. m, midbrain. h, hindbrain. Asterisk, autofluorescence of pigment. e–f Phospho-histone H3 (PH3) staining indicated no difference in the number of cells in mitosis in the brain between CTRL and PT. Independent t test. Scale bar, 20 µm. g, h qPCR but not light-sheet imaging showed significantly increased expression or the number of mpx1 + neutrophils in the head at 1 dpt. Independent t test, **, p < 0.01. Scale bar, 40 µm. Asterisk, autofluorescence of pigment. i–j Light-sheet imaging and qPCR showed significantly increased expression or the number of mepg1 + macrophages in the head at 1 dpt. Independent t test, **, p < 0.01. Scale bar, 40 µm. k Flow cytometry detected an increased number of mepg1 + macrophages in the head after peripheral trauma. (l) No difference in rag1 + lymphocytes (red arrow) was found in whole-mount in situ hybridization (WISH) between CTRL and PT. Scale bar, 40 µm. m qPCR showed significantly increased expression of lcp1 + leukocytes in the head after peripheral trauma. Independent t test, **, p < 0.01. n Experimental setup for dendra2 photoconversion and peripheral leukocyte tracking. o–p A significantly elevated number of photoconverted magenta+ leukocytes (white arrow) in the brains of zebrafish after peripheral trauma. Independent t test, **, p < 0.01. Scale bar, 40 µm. |
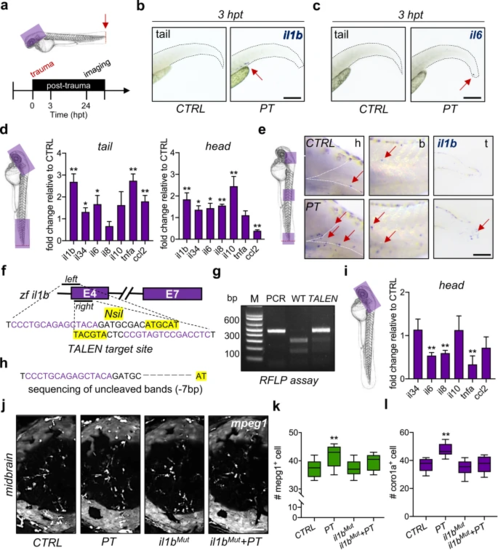
a Experimental setup. hpt, hours post-trauma. b, c The expression of il1b + and il6 + cells (red arrow) in zebrafish larvae was measured by WISH at 3 hpt. Scale bar, 200 µm. d qPCR showed that the mRNA levels of various cytokines or chemokines changed in the traumatic site/tail and the brain/head compared to CTRL. Independent t test, *, p < 0.05, **, p < 0.01. e WISH showed increased il1b + cells (red arrow) in the brain/head, body/trunk, and traumatic site/tail of zebrafish larvae at 24 hpt. Scale bar, 100 µm. h, head. b, body. t, tail. f Design of the transcription activator-like effector nucleases (TALEN) targeting zebrafish il1b. g, h il1b mutation (il1bMut) was confirmed by the restriction fragment length polymorphism (RFLP) assay and Sanger sequencing (−7 bp). (i) qPCR showed that the mRNA levels of various cytokines were decreased in il1bMut zebrafish brains compared to CTRL brains. Independent t test, **, p < 0.01. j–l il1bMut rescued the increased mpeg1 + macrophages or coro1a + leukocytes in the zebrafish brain at 24 hpt. Two-way ANOVA with Tukey’s HSD post hoc test, **, p < 0.01 compared to CTRL. Scale bar, 40 µm. |
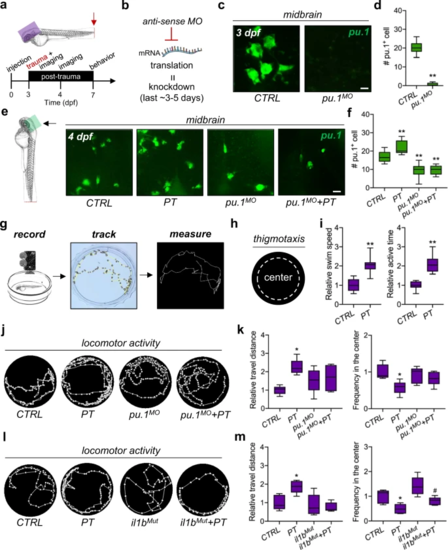
a Experimental setup. b Schematic showing antisense morpholino (MO)-mediated transient knockdown. c, d Light-sheet imaging showed a significantly decreased number of pu.1 + myeloid cells by pu.1 MO knockdown in the zebrafish brain at 3 dpf. Independent t test, **, p < 0.01. Scale bar, 10 µm. e, f Light-sheet imaging showed that pu.1 MO knockdown inhibited the increase in pu.1 + myeloid cells in the zebrafish brain at 1 dpt. Two-way ANOVA with Tukey’s HSD post hoc test, **, p < 0.01 compared with CTRL. Scale bar, 20 µm. g, h Schematic showing the locomotor behavioral assay and thigmotaxis for zebrafish larvae. i Peripheral trauma increased the swim speed and active time of zebrafish larvae at 7 dpf/4 dpt. Independent t test, **, p < 0.01. j–k Behavioral assays suggested anxiety-like behaviors, including hyperactivity and thigmotaxis, in zebrafish at 4 dpi, which could be rescued by pu.1 MO knockdown. Two-way ANOVA with Tukey’s HSD post hoc test, *, p < 0.05 compared with CTRL. l–m il1b mutation rescued hyperactivity but not thigmotaxis at 4 dpi. Two-way ANOVA with Tukey’s HSD post hoc test, *, p < 0.05 compared to CTRL, #, p < 0.05 compared to il1bMut. EXPRESSION / LABELING:
PHENOTYPE:
|
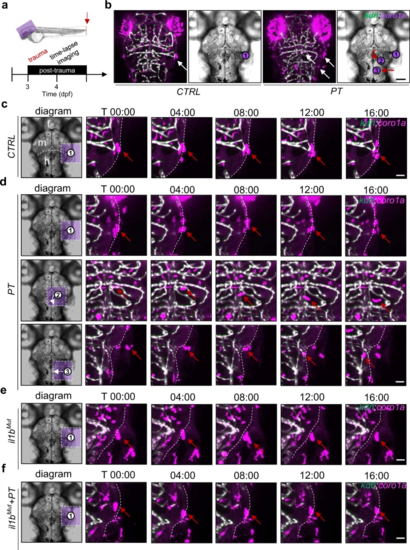
a Experimental setup. b Active leukocytes (white arrow) were distributed in the brains of zebrafish with or without peripheral trauma. Scale bar, 40 µm. c Time-lapse light-sheet imaging showed the active leukocytes (red arrow) around the zebrafish brain in CTRL. Scale bar, 20 µm. d Time-lapse light-sheet imaging showed active leukocytes (red arrow) around the brain (1), inside the brain (2), and invading the brain (3) at 4 dpf. Scale bar, 20 µm. e Time-lapse light-sheet imaging showed the active leukocytes (red arrow) around the brain in il1bMut zebrafish. Scale bar, 20 µm. f Time-lapse light-sheet imaging showed the active leukocytes (red arrow) around the brain in il1bMut zebrafish at 4 dpf. Scale bar, 20 µm. PHENOTYPE:
|

a Experimental setup. b, d Light-sheet imaging showed an increased number and percentage of the colocalization of coro1a + leukocytes and AO + apoptotic cells in the zebrafish brain at 4 dpt. Independent t test, **, p < 0.01 compared with CTRL. c, e Light-sheet imaging showed an increased number of AO + apoptotic cells in the zebrafish brain at 1 dpt but not at 2 dpt. Independent t test, **, p < 0.01 compared to CTRL. f Light-sheet imaging showed that mpeg1 + macrophages returned to the CHT at 2 dpt. Two-way ANOVA with Tukey’s HSD post hoc test, **, p < 0.01 compared to CTRL at 1 dpt, #, p < 0.05 compared to CTRL at 2 dpt. Scale bar, 5 µm. g Schematic showing that apoptosis in the brain is associated with leukocyte distribution. h–k il1b mutation rescued the increased number of AO + or TUNEL + apoptotic cells in the zebrafish brain at 1 dpi. Two-way ANOVA with Tukey’s HSD post hoc test, **, p < 0.01 compared to CTRL. Scale bar, 40 µm. PHENOTYPE:
|
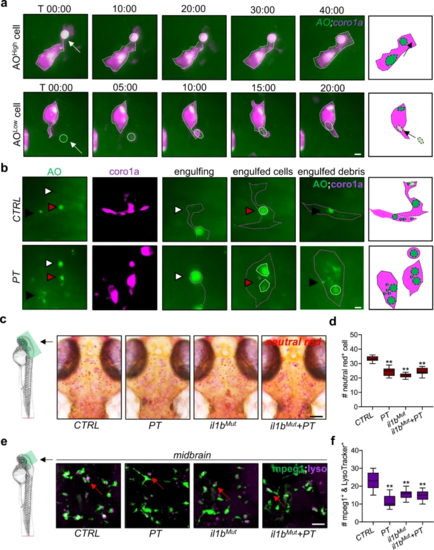
a, b Time-lapse light-sheet imaging showed the phagocytosis of AOhigh and AOlow cells (white arrow or arrowhead) by coro1a + leukocytes in the zebrafish brain at 1 dpt. c, d Neutral red staining showed microglial lysosome impairment in zebrafish brains with or without il1b mutation at 1 dpt. Two-way ANOVA with Tukey’s HSD post hoc test, **, p < 0.01 compared to CTRL. Scale bar, 40 µm. e, f LysoTracker staining showed mpeg1 + microglial lysosome impairment in the zebrafish brain at 1 dpt or under il1b mutation. Two-way ANOVA with Tukey’s HSD post hoc test, **, p < 0.01 compared to CTRL. Scale bar, 20 µm. PHENOTYPE:
|

a Experimental setup. b Schematic showing the proteomic analysis in the head region of zebrafish larvae after peripheral trauma. MS, mass spectrometry. c Heatmap illustrating the fold change in proteins among the CTRL, PT, il1bMut, and il1bMut + PT groups. d The volcano plot illustrates the proteins that were significantly (p < 0.05) changed (>1.5-fold) in the head region of zebrafish after peripheral trauma and the change in these identified proteins (purple) in various conditions: (1) PT/CTRL, (2) il1bMut + PT/CTRL, and (3) il1bMut + PT/il1bMut. n, the number of identified proteins that significantly increased. e The relative levels of proteins in the CTRL, CTRL + PT, il1bMut, and il1bMut + PT groups. Two-way ANOVA with Tukey’s HSD post hoc test, *, p < 0.05, **, p < 0.01 compared with CTRL. |
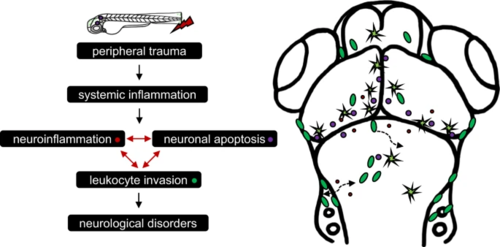
Schematic diagram of systemic inflammation-mediated leukocyte invasion and its impacts on the brain after peripheral trauma. |