
Fig. 5
- ID
- ZDB-IMAGE-220810-20
- Publication
- Chen et al., 2022 - Leukocyte invasion of the brain after peripheral trauma in zebrafish (Danio rerio)
- All Figures
- Figures for Chen et al., 2022
|
Fig. 5
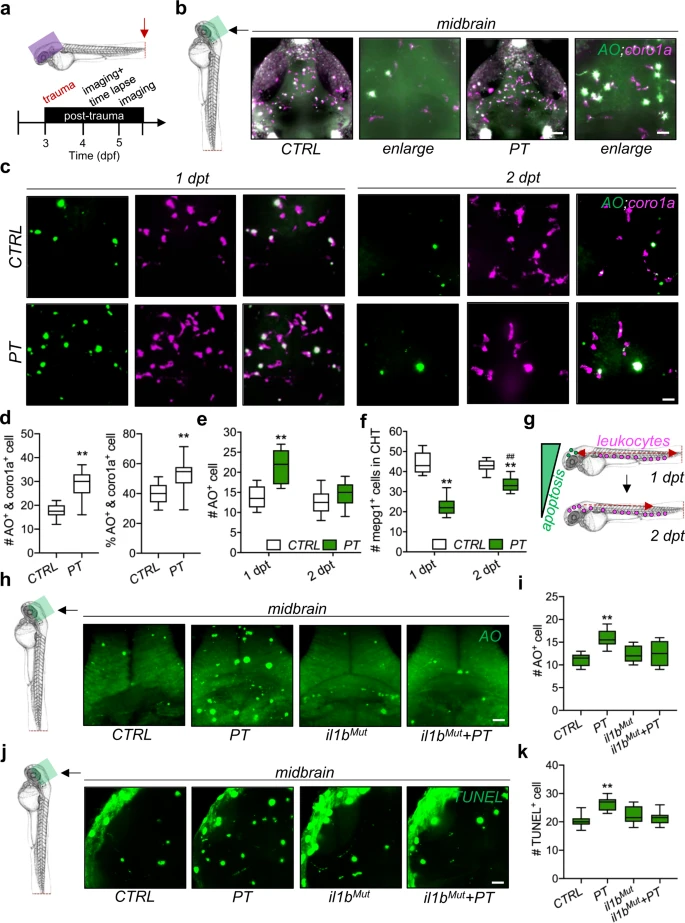
a Experimental setup. b, d Light-sheet imaging showed an increased number and percentage of the colocalization of coro1a + leukocytes and AO + apoptotic cells in the zebrafish brain at 4 dpt. Independent t test, **, p < 0.01 compared with CTRL. c, e Light-sheet imaging showed an increased number of AO + apoptotic cells in the zebrafish brain at 1 dpt but not at 2 dpt. Independent t test, **, p < 0.01 compared to CTRL. f Light-sheet imaging showed that mpeg1 + macrophages returned to the CHT at 2 dpt. Two-way ANOVA with Tukey’s HSD post hoc test, **, p < 0.01 compared to CTRL at 1 dpt, #, p < 0.05 compared to CTRL at 2 dpt. Scale bar, 5 µm. g Schematic showing that apoptosis in the brain is associated with leukocyte distribution. h–k il1b mutation rescued the increased number of AO + or TUNEL + apoptotic cells in the zebrafish brain at 1 dpi. Two-way ANOVA with Tukey’s HSD post hoc test, **, p < 0.01 compared to CTRL. Scale bar, 40 µm.