
- Title
-
Zebrafish beta-adrenergic receptor mRNA expression and control of pigmentation
- Authors
- Wang, Z., Nishimura, Y., Shimada, Y., Umemoto, N., Hirano, M., Zang, L., Oka, T., Sakamoto, C., Kuroyanagi, J., and Tanaka, T.
- Source
- Full text @ Gene
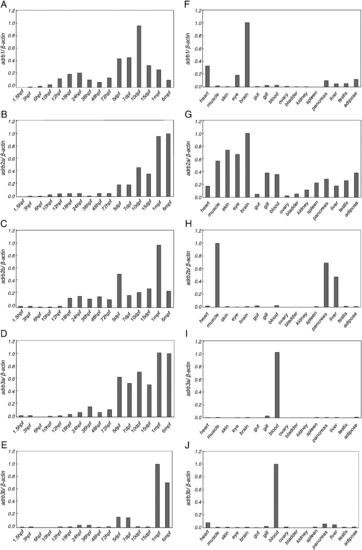
mRNA expression of zebrafish adrb family in developmental stages and adult tissues. Developmental profiles of gene expression are shown on the right (A–E); relative mRNA expression levels in tissues of zebrafish at 6 mpf are shown on the left (F–J). Six individual zebrafish at 6 mpf were used for organ-specific RNA isolation. SYBR Green-based quantitative real-time PCR was used to quantify the expression levels of adrb family. Relative transcript ratios were determined by normalizing threshold cycles (Ct) values to β-actin expression. Data are presented relative to the value in the most highly expressing time point or tissue. EXPRESSION / LABELING:
|
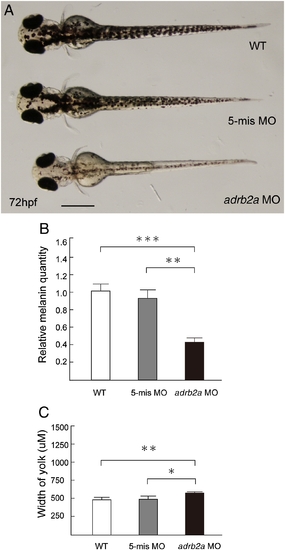
Zebrafish adrb2a loss of function experiments. adrb2a MOs were injected into 1–4-cell stage embryos. (A) Representative images of the dorsal view of wild-type (upper), 5-base mismatch control MO (middle) and adrb2a MO-injected larvae (lower) at 72 hpf. Scale bar indicates 500 μm. (B) Effect of adrb2a MOs on melanin. Five larvae were collected at 72 hpf and dissolved in lysis buffer. After centrifugation, melanin pigment was redissolved in 1 N NaOH, and then total melanin content was quantified by spectrophotometry. Data are presented relative to the wild-type value and are the mean values ± SEM of 12 independent experiments. (C) Width of yolk was measured using NIS Elements D2.20 image analysis software (Nikon). Data are presented as the means ± SEM of 20 larvae at 96 hpf. ∗P < 0.05; ∗∗P < 0.01; ∗∗∗P < 0.001. PHENOTYPE:
|
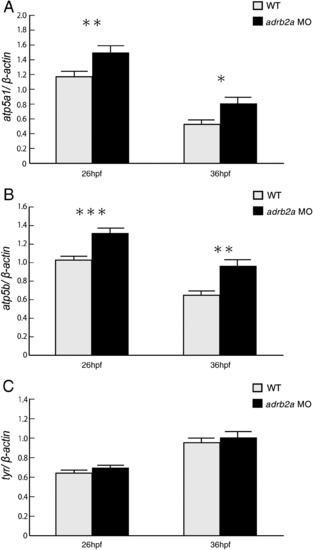
Effects of adrb2a knock-down on atp5a1, atp5b, and tyr mRNA expression. MOs were injected into 1–4-cell stage embryos. The mRNA expression in wild-type embryos and in embryos injected with adrb2a MOs was quantified by qPCR at 26 and 36 hpf as the hypopigmentation phenotype induced by adrb2a MOs became identifiable at 36 hpf. (A) atp5a1 mRNA expression. (B) atp5b mRNA expression. (C) tyr mRNA expression. Data are presented as the means ± SEM of 12 independent experiments, after normalization to the expression of β-actin. ∗P < 0.05; ∗∗P < 0.01; ∗∗∗P < 0.001. |

Pigment development in zebrafish adrb2a morphants. Representative images of the dorsal view of wild-type (upper), 5 mismatch control MO (middle) and adrb2a MO-injected larvae (lower) from 48 hpf to 10 dpf. The difference in pigmentation between adrb2a morphants and wild-type fish became recognizable at 36 hpf and became most distinguished from about 48 hpf to 96 hpf, remaining distinguishable until 10 dpf. |

Zebrafish β-ARs loss of function experiments. 1–4-cell stage embryos were injected with 6.7 ng (for adrb1 and adrb3a) or 1.7 ng (for adrb2b and adrb3b) of MO. (A) Zebrafish treated with the MO against adrb1 showed curved bodies, larger yolks and early larval lethality. (B–C). Zebrafish adrb2b MO induced embryo malformation. (B) adrb2b MO-injected living embryos grown to 32 hpf are shown. Note the abnormal body shape and the small size of the head. (C) The same embryos in panel (B) developed severe edema at 120 hpf. (D) adrb3a MOs had no observable effect on developing zebrafish embryos. adrb3a MO-injected living embryos grown to 60 hpf are shown. (E–F) Zebrafish adrb3b MO induced embryo malformation and early larval lethality. (E) adrb3b MO-injected living embryos grown to 32 hpf are shown. Note the malformations of the cervical region and the head. (F) Five of 14 embryos shown in panel (E) survived to 56 hpf. Note the abnormal shape of body and head. |

Unillustrated author statements |
Reprinted from Gene, 446(1), Wang, Z., Nishimura, Y., Shimada, Y., Umemoto, N., Hirano, M., Zang, L., Oka, T., Sakamoto, C., Kuroyanagi, J., and Tanaka, T., Zebrafish beta-adrenergic receptor mRNA expression and control of pigmentation, 18-27, Copyright (2009) with permission from Elsevier. Full text @ Gene