
Fig. 3
- ID
- ZDB-FIG-100415-4
- Publication
- Wang et al., 2009 - Zebrafish beta-adrenergic receptor mRNA expression and control of pigmentation
- Other Figures
- All Figure Page
- Back to All Figure Page
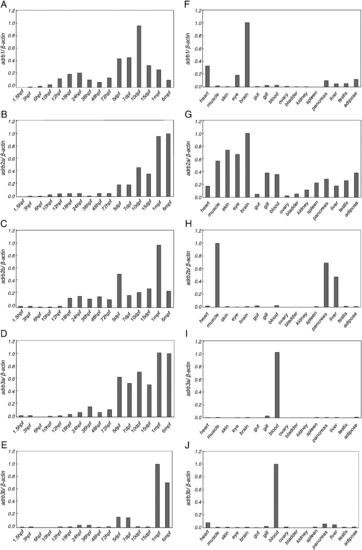
mRNA expression of zebrafish adrb family in developmental stages and adult tissues. Developmental profiles of gene expression are shown on the right (A–E); relative mRNA expression levels in tissues of zebrafish at 6 mpf are shown on the left (F–J). Six individual zebrafish at 6 mpf were used for organ-specific RNA isolation. SYBR Green-based quantitative real-time PCR was used to quantify the expression levels of adrb family. Relative transcript ratios were determined by normalizing threshold cycles (Ct) values to β-actin expression. Data are presented relative to the value in the most highly expressing time point or tissue. |
| Genes: | |
|---|---|
| Fish: | |
| Anatomical Terms: | |
| Stage Range: | 5-9 somites to Adult |
Reprinted from Gene, 446(1), Wang, Z., Nishimura, Y., Shimada, Y., Umemoto, N., Hirano, M., Zang, L., Oka, T., Sakamoto, C., Kuroyanagi, J., and Tanaka, T., Zebrafish beta-adrenergic receptor mRNA expression and control of pigmentation, 18-27, Copyright (2009) with permission from Elsevier. Full text @ Gene