
Fig. 3
|
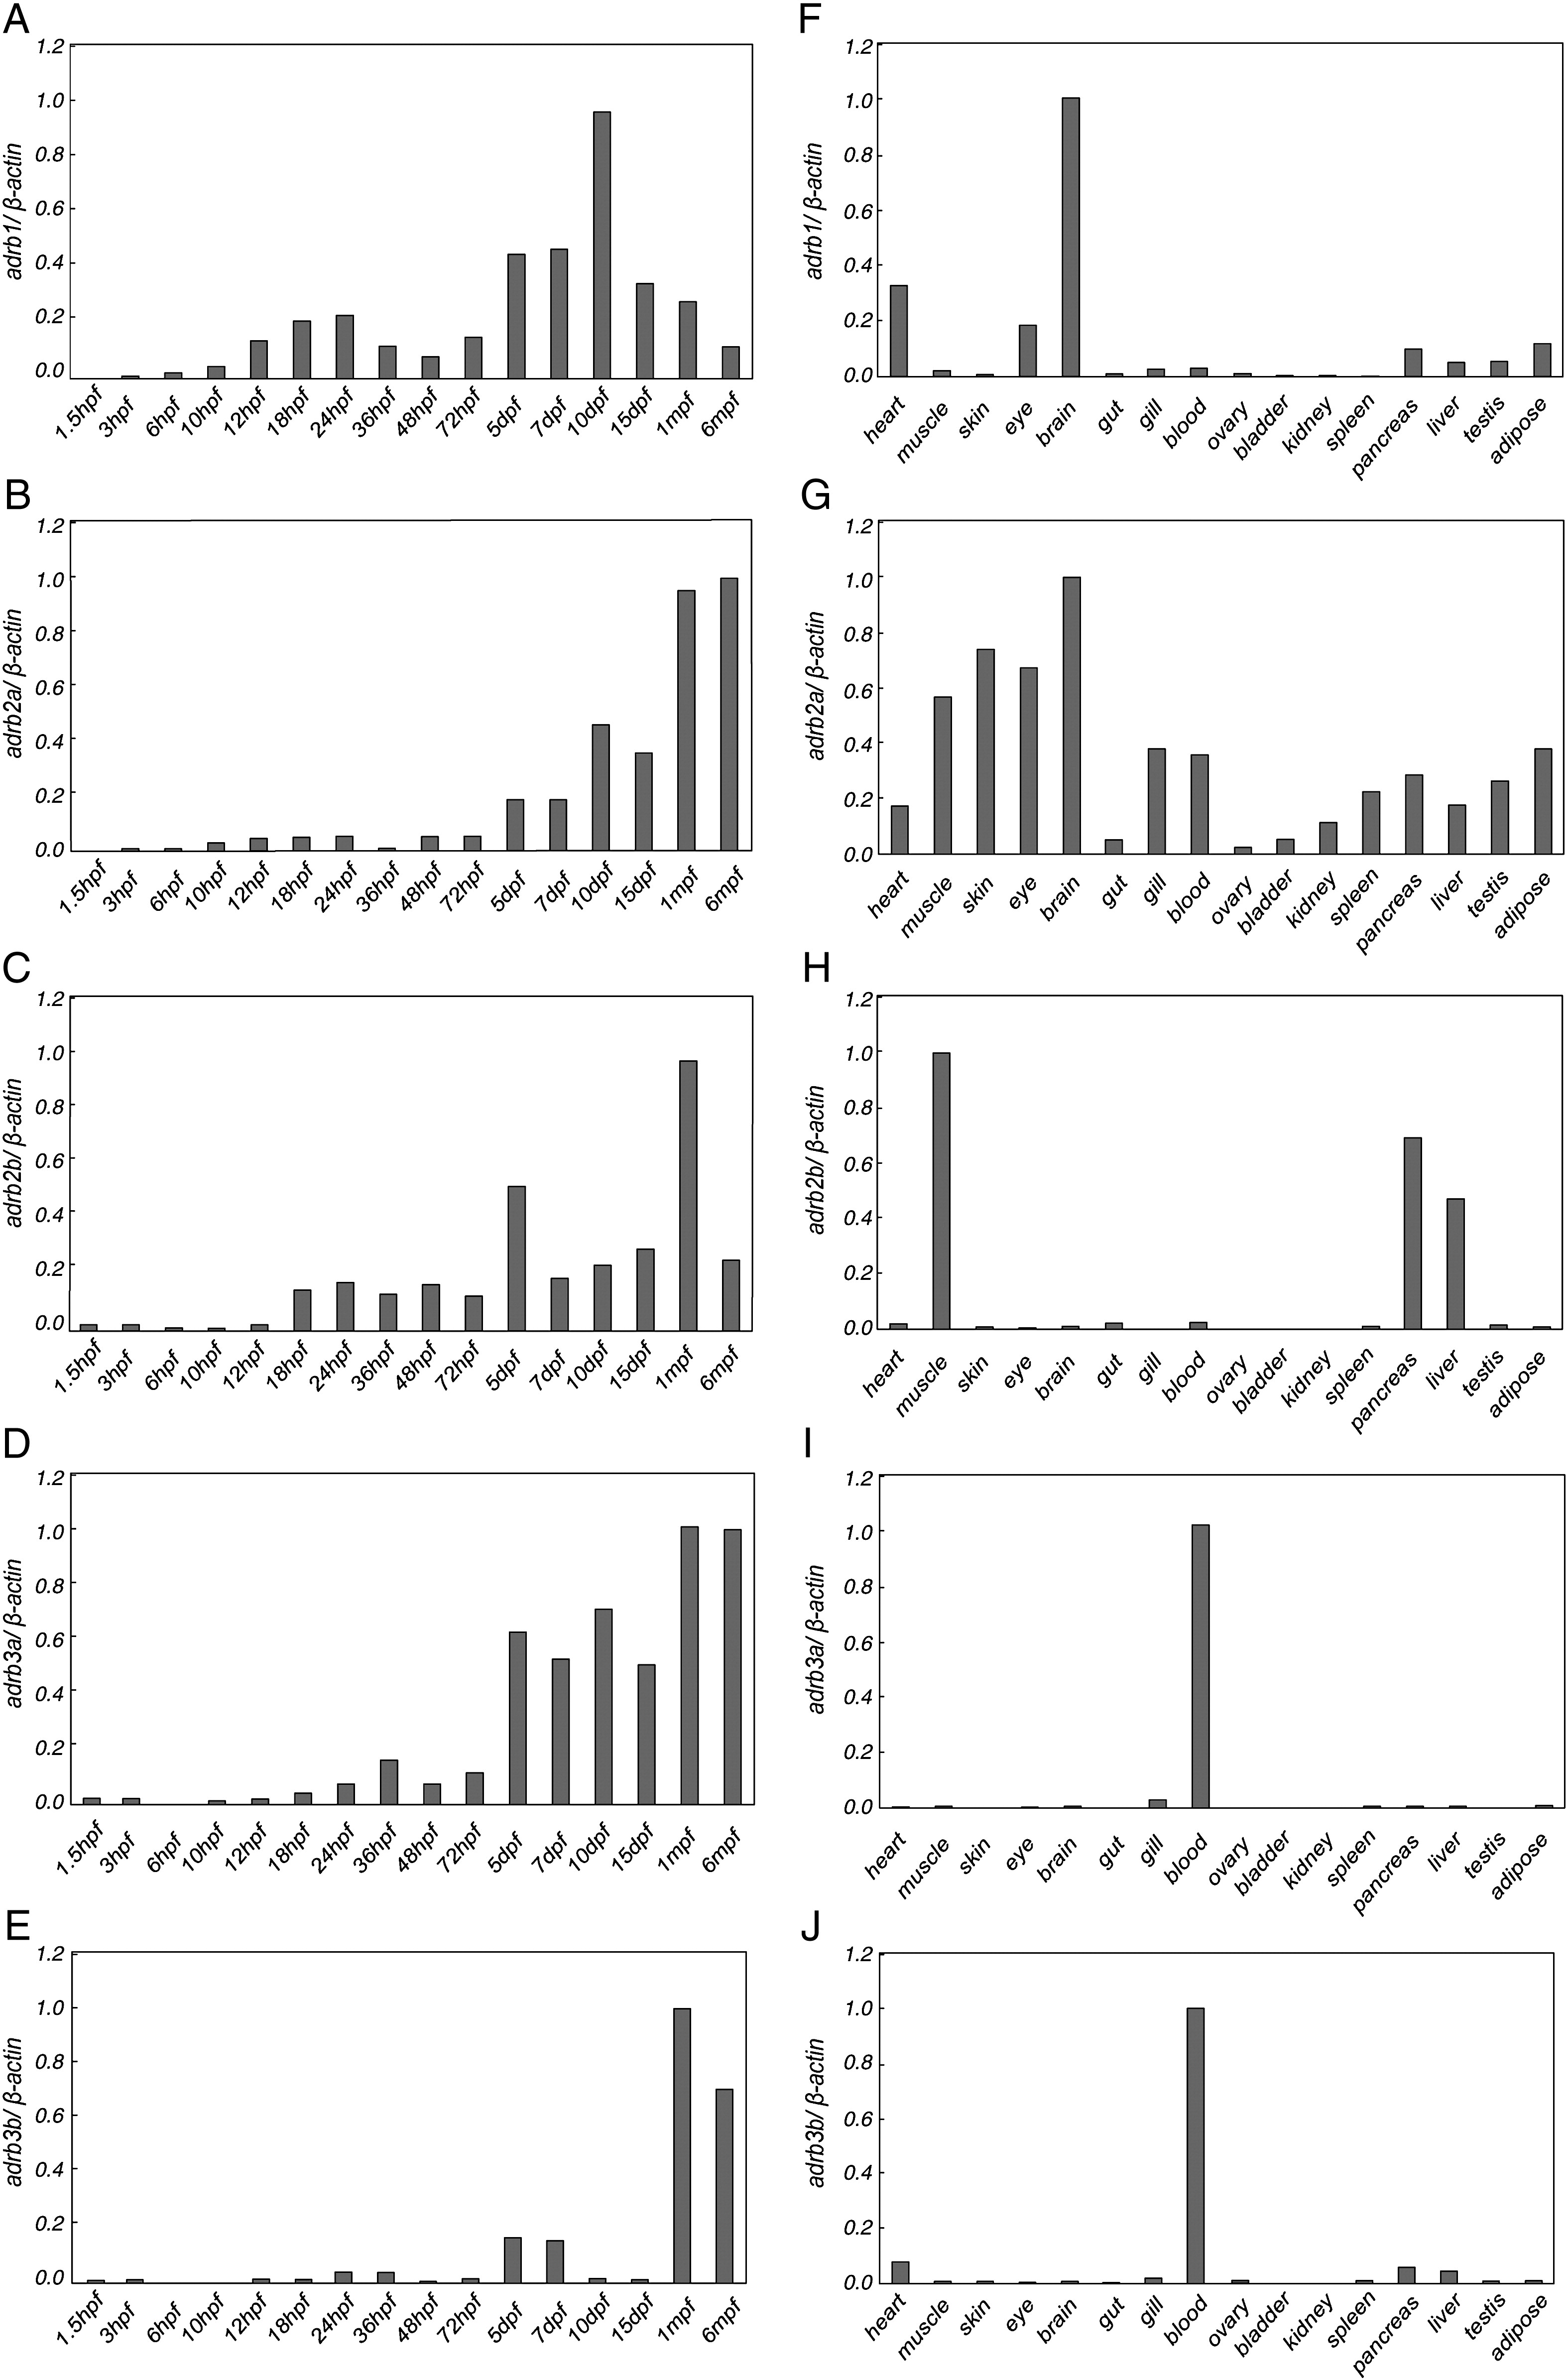
Fig. 3 mRNA expression of zebrafish adrb family in developmental stages and adult tissues. Developmental profiles of gene expression are shown on the right (A–E); relative mRNA expression levels in tissues of zebrafish at 6 mpf are shown on the left (F–J). Six individual zebrafish at 6 mpf were used for organ-specific RNA isolation. SYBR Green-based quantitative real-time PCR was used to quantify the expression levels of adrb family. Relative transcript ratios were determined by normalizing threshold cycles (Ct) values to β-actin expression. Data are presented relative to the value in the most highly expressing time point or tissue.
Reprinted from Gene, 446(1), Wang, Z., Nishimura, Y., Shimada, Y., Umemoto, N., Hirano, M., Zang, L., Oka, T., Sakamoto, C., Kuroyanagi, J., and Tanaka, T., Zebrafish beta-adrenergic receptor mRNA expression and control of pigmentation, 18-27, Copyright (2009) with permission from Elsevier. Full text @ Gene