
- Title
-
The zinc finger protein Zfpm1 modulates ventricular trabeculation through Neuregulin-ErbB signalling
- Authors
- Yang, Y., Li, B., Zhang, X., Zhao, Q., Lou, X.
- Source
- Full text @ Dev. Biol.
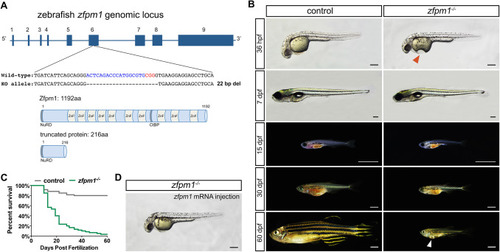
Generation of Zfpm1 knock out zebrafish line. (A): Upper panel, the zebrafish Zfpm1 genomic locus and Cas9/sgRNA targeting site. Deletions in ∆22 allele are shown as dashes. Lower panel, schematic representations of the domain structure of the wild-type zebrafish Zfpm1 protein and truncated protein derived from the ∆22 allele. (B) Live images of control and Zfpm1-/- zebrafish at designated time points. Lateral view, anterior to the left. Red arrowhead indicates the depression on the yolk of Zfpm1-/-embryo, white arrowhead indicates the bulge on the ventral side of Zfpm1-/-fish. For 36hpf embryos and 7dpf larvae, scale bar: 200 µm. For animal from 15 dpf to 60 dpf, scale bar: 2 mm. (C) Representative Kaplan-Meier plot for Zfpm1-/- fish and clutchmates from one of three independent experiments. 80 total Zfpm1-/- animals and 88 total siblings were followed. P < 0.0001, Mantel-Cox test. (D) Injection of Zfpm1 mRNA rescue the morphological defects in Zfpm1-/- embryos. Scale bar: 200 µm. (For interpretation of the references to color in this figure legend, the reader is referred to the web version of this article.)
PHENOTYPE:
|
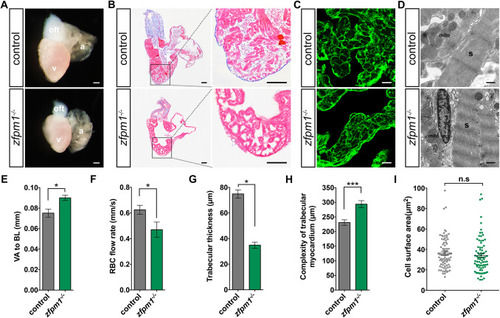
Loss of Zfpm1 results in cardiac chamber maturation defects. (A) Representative images of dissected hearts from Zfpm1-/- and WT sibling fish at 60 dpf. a, atrium; v, ventricle; oft, outflow tract. Scale bar: 200 µm. (B) Histological analysis of Zfpm1-/- and WT sibling fish. Heart sections were Masson's trichrome stained. Scale bar: 100 µm. (C) Representative images of ventricle sections stained with WGA to indicate cardiomyocyte cell size at 60 dpf. Scale bar: 10 µm. (D) Transmission electron microscopy (TEM) on control and Zfpm1-/- hearts revealed no overt defects on myocardium ultrastructure. s, sarcomere; mito, mitochondrion; Scale bar: 5 µm. (E) Quantification of ventricle area to fish length (VA/BL) index, which was used as a measurement of the cardiomegaly. 10 control fish and 5 Zfpm1-/-fish were examined. (F) Quantification of red blood cell flow rate, which was used as a measurement of the cardiac function. 8 control fish and 7 Zfpm1-/- fish were examined. (G) Quantification of trabecular thickness at 60 dpf. (H) Quantification of the complexity of trabecular myocardium layer at 60 dpf. G to H, 12 sections from 3 wt and 12 sections from 3 Zfpm1-/- fish were examined. E to H, data are mean ± s.e.m. (I) Quantification of cardiomyocyte cell size in control and Zfpm1-/ - fish. The surface area of individual cardiomyocyte was plotted. Sections from 3 fish for each genotype were examined. n.s: not significant. * p < 0.05. ** p < 0.01. *** p < 0.001.
PHENOTYPE:
|
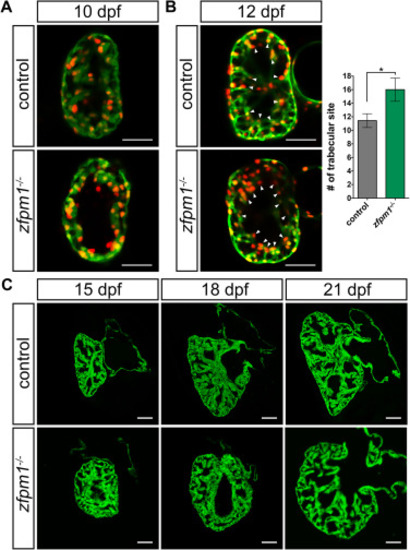
Loss of Zfpm1 led to trabeculation deformation in ventricle. (A) Confocal images (mid-sagittal optical sections) of larval hearts from control and Zfpm1-/- animals at 10 dpf. (B) Left panels, confocal images (mid-sagittal optical sections) of larval hearts from control and Zfpm1-/- animals at 12 dpf. Arrowheads indicated sites where trabecular is initiating. Right panel, quantification of number trabecular initiation site on section. 8 sections from control and 12 sections from Zfpm1-/- fish were examined. Data are mean ± s.e.m. * p < 0.05. A and B, cardiomyocyte was labeled with Tg(myh7: GFP; myh7: DsRed-Nuc) transgenes. (C) Confocal projections of zebrafish juvenile hearts section at designated time points showing the abnormal trabeculation in Zfpm1-/- animals. Cardiomyocyte was labeled with Tg(myh7: GFP) transgene. Scale bars, 50 µm.
PHENOTYPE:
|

ZFIN is incorporating published figure images and captions as part of an ongoing project. Figures from some publications have not yet been curated, or are not available for display because of copyright restrictions. EXPRESSION / LABELING:
PHENOTYPE:
|

Loss of Zfpm1 led to the elevation of Neuregulin-ErbB signalling activity and transit enhanced cardiomyocytes proliferation. (A) Left panel, in situ hybridization for nrg1 on ventricle sections from 18 days old control and Zfpm1 mutant animals. Right panel, qPCR experiments confirmed up-regulation of nrg1 in endocardial cell. Error bars represent mean ± SEM. ** p < 0.01. (B) Left panel, representative Western blot demonstrating elevated phosphor-MAPK and phosphor-AKT level in hearts of Zfpm1 mutant animals. Tubulin and total AKT were used as loading control. Left panel, quantification of phosphor-MAPK and phosphor-AKT proteins normalized by either Tublin or total AKT. Error bars represent mean ± SEM. * p < 0.05. (C) In situ hybridization for Neuregulin-ErbB signalling target genes on ventricle sections from 18 days old control and Zfpm1 mutant animals. (D) Ventricles from 18 days old control and Zfpm1 mutant animals stained for BrdU incorporation (red) to assess cardiomyocyte proliferation. Middle panels, high-magnification images of the boxed areas in the left panels. Arrowheads indicated the proliferating cardiomyocytes. Scale bar: 50 µm. Right panel, quantification of BrdU-positive nuclei in Zfpm1-/- ventricle, data are mean ± s.e.m. Tg(myh7: GFP) transgene was introduced to identify cardiomyocyte. 8 sections from 4 control and 8 sections from 3 Zfpm1-/-fish were examined. ** p < 0.01. (For interpretation of the references to color in this figure legend, the reader is referred to the web version of this article.) EXPRESSION / LABELING:
PHENOTYPE:
|
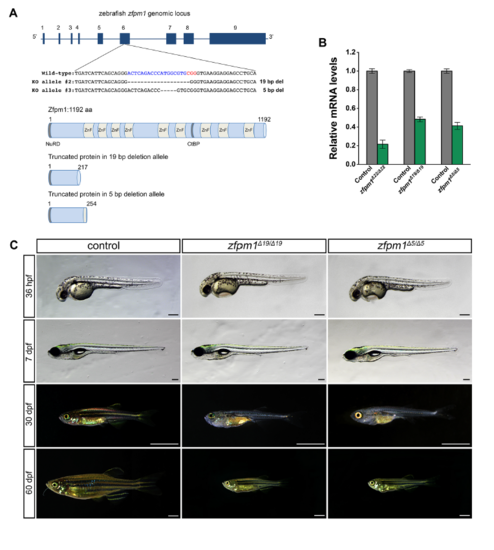
Different zfpm1 knock out alleles presented consistent phenotype. (A): Schematic illustration of two zfpm1 targeting alleles. Upper panel, the zebrafish zfpm1 genomic locus and Cas9/sgRNA targeting site. Deletions are shown as dashes. Lower panel, schematic representations of the domain structure of the wild type zebrafish Zfpm1 protein and truncated proteins derived from the Δ19 and Δ5 allele. The binding sites of the gRNAs (blue line) were indicated with the sgRNA sequence and PAM labeled with blue and red respectively. (B): zfpm1 mRNA level in different KO alleles. (C) Live images of control, zfpm1Δ19 /Δ19 and zfpm1Δ5 /Δ5 3 zebrafish at designated time points. Lateral view, anterior to the left. For 36hpf embryos and 7dpf larvae, scale bar: 200 μm. For animal from 30 dpf and 60 dpf, scale bar: 2mm. PHENOTYPE:
|
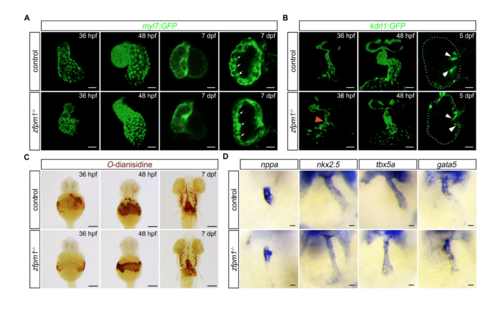
Characterization of early heart development and primitive erythropoiesis in zfpm1-/- embryos. (A) Morphology of embryonic hearts (revealed by Tg(myh7: GFP) transgene ) in indicated genetic backgrounds at designated time points. Arrows indicating the initiation of trabecular. Ventral views with anterior to the top. Scale bar: 200μm. (B) Endocardium and cardiac valve development are observed in live control and zfpm1-/- embryos by introduction of Tg(kdrl: GFP) transgene. Red arrowhead indicated the stenosis in zfpm1-/- heart. White arrowheads indicated superior and inferior valve leaflets. Ventral views with anterior to the top. Scale bar: 200μm. (C) Whole-mount embryo o-dianisidine staining showed transient abnormal erythropoiesis in zfpm1-/- embryos. Ventral views with anterior to the top. Scale bar: 200μm. (D) RNA in situ hybridization is shown for cardiogenic regulatory gene expression in control and zfpm1 mutant zebrafish embryos at 36 hpf; frontal views with dorsal side to the top. Scale bar: 20μm. |

Zebrafish zfpm1 expression pattern revealed by in situ hybridization. (A): No maternal deposit zfpm1 mRNA was detected in embryo prior to maternal-zygotic transition. (BC): Expression of zfpm1 could be observed in erythroid progenitor cells from 8-somite stage. (DD’): At 24hpf zfpm1 mRNA could be observed in heart tube, trunk neurons and otic vesicle. (EH): Later on, the zfpm1 expression could be observed in heart, a subpopulation of brain neuron. (I and J): On section in situ hybridization showed expression of zfpm1 mRNA in endocardium during heart chamber maturation. A, lateral view. B, dorsal view. C, lateral view with head to top. D, E, F, G and H, lateral view with head to left. D’, E’, F’, G’ and H’, cranial view. White arrow in D’, E’, G’ and H’ indicated mRNA expression in heart. hpf, hour past fertilization. dpf, day past fertilization. EXPRESSION / LABELING:
|
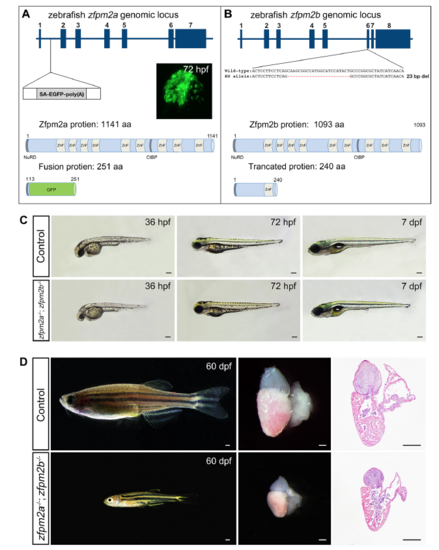
Loss of zfpm2a and zfpm2b in zebrafish did not cause defects in cardiac chamber development. (A) The zebrafish zfpm2a genomic locus. Exons (blue boxes) are numbered. The transposon is inserted after the first intron. Inset panel, fusion GFP expression in embryonic heart at 72 hpf. Lower panel, schematic representations of the domain structure of the zebrafish Zfpm2a protein. Insertion of the gene-trapping element results in a fusion transcript that will be translated into a fusion protein containing the first 13 amino acids from Zfpm2a at the 7 N-terminus. (B) The zebrafish zfpm1 genomic locus. Deletions in Δ23 allele introduced by CRISPY/Cas9 targeting are shown as dashes. Lower panel, schematic representations of the domain structure of the zebrafish Zfpm2b protein and truncated protein derived from the Δ23 allele. (C) Live images of control and zfpm2a-/-; zfpm2b-/- zebrafish embryos at designated time points. Lateral view, anterior to the left. (C) Left panels, live images of control and zfpm2a-/-, zfpm2b-/- zebrafish at 60 dpf. Lateral view, anterior to the left. Middle panels, representative images of dissected hearts from zfpm2a-/-; zfpm2b-/- and WT sibling fish at 60 dpf. Right panels, histological analysis of hearts of zfpm2a-/-; zfpm2b-/- and WT sibling fish. Sections were Masson's trichrome stained. Scale bars: 200μm. EXPRESSION / LABELING:
PHENOTYPE:
|
Reprinted from Developmental Biology, 446(2), Yang, Y., Li, B., Zhang, X., Zhao, Q., Lou, X., The zinc finger protein Zfpm1 modulates ventricular trabeculation through Neuregulin-ErbB signalling, 142-150, Copyright (2019) with permission from Elsevier. Full text @ Dev. Biol.