FIGURE SUMMARY
Title

Low molecular weight fucoidan inhibits hepatocarcinogenesis and nonalcoholic fatty liver disease in zebrafish via ASGR/STAT3/HNF4A signaling

Authors
Wu, S.Y., Yang, W.Y., Cheng, C.C., Lin, K.H., Sampurna, B.P., Chan, S.M., Yuh, C.H.
Source
Full text @ Clin Transl Med

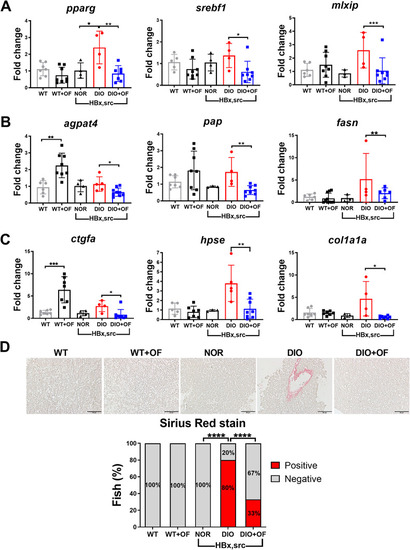
Oligo‐fucoidan pre‐treatment reduced the expression of lipogenesis genes, fibrosis marker and decreased the levels of collagen fibers in adult [HBx,src] transgenic zebrafish. A, Expression of lipogenic factors (pparg, mlxip, and srebf1), B, lipogenic enzymes (agpat4, pap and fasn), and C, fibrosis markers (ctgfa, hpse, and col1a1a). Data are presented as dot plots, each dots represent one fish. Statistical significance was calculated by t‐test (*P ≤ .05, **P ≤ .01, ***P ≤ .001). D, Representative images and statistical analysis of Sirius Red stain in [HBx,src] transgenic fish. Scale bar represents 50 μm. WT represents non‐transgenic wild‐type control fish, WT+OF stands for WT fish feeding with OF, NOR indicates normal diet, DIO denotes diet‐induced obesity, DIO+OF represents DIO fish given oral gavage with 0.051 mg OF.

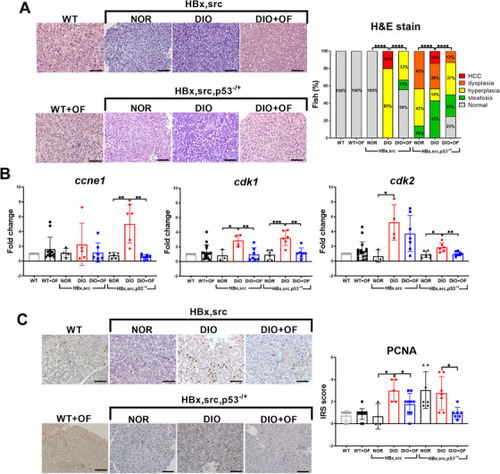
Oligo‐fucoidan pre‐treatment suppressed oncogene‐ and diet‐induced obesity‐mediated carcinogenesis in adult [HBx,src] and [HBx,src,p53−/+] transgenic zebrafish. A Representative H&E images show typical pathological tissue structures in hepatic tissues of [HBx,src] and [HBx,src,p53−/+] transgenic zebrafish that had been fed by normal diet (NOR, N > 4), diet‐induced obesity (DIO, N > 9), and DIO with OF (DIO+OF, N > 9). Both the non‐transgenic wild‐type control fish (WT) oral feeding with OF (WT+OF) show normal hepatocyte. The incidences of pathological alterations from two transgenic fish fed with distinct diets were shown as stacking bar chart. Statistical significance was calculated by chi‐square analysis (****P ≤ .0001). B, Analyses of mRNA levels of cell proliferation markers: ccne1, cyclin‐E1; cdk1, cyclin‐dependent kinase‐1; cdk2, cyclin‐dependent kinase 2 in [HBx,src] and [HBx,src,p53−/+] with normal diets (NOR), overfeeding (DIO), or DIO together with OF (DIO+OF), WT and WT+OF indicate non‐transgenic wild‐type fish without OF and with OF. Data are presented as dot plots. Statistical significance was calculated by t‐test (*P ≤ .05, **P ≤ .01, ***P ≤ .001). C, Representative proliferating cell nuclear antigen (PCNA) stain images in hepatic tissues of [HBx,src] and [HBx,src,p53−/+] transgenic zebrafish fed by different diets and OF. The corresponding immunoreactive scores (IRSs) of the PCNA staining were calculated by multiplying the staining intensity by the proportion of positive cells. Scale bars equal to 50 μm. Data are presented as dot plots. Statistical significance was calculated by t‐test (*P ≤ .05).

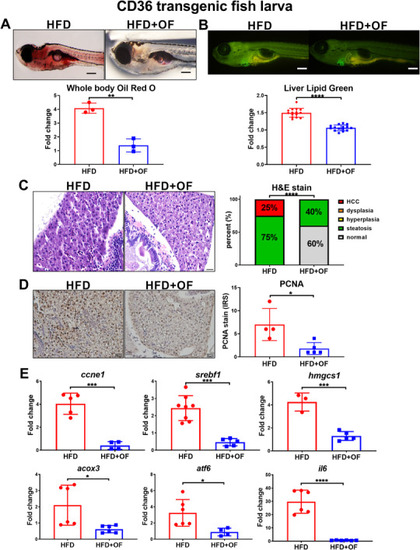
Oligo‐fucoidan exhibits anti‐lipid accumulation and anti‐HCC effect in CD36 transgenic fish model. A, The anti‐lipid accumulation effect of fucoidan in a 15‐day‐old CD36 transgenic fish model revealed by Oil Red staining from CD36 transgenic fish fed with 24% high fat diet without or with fucoidan. The statistical analysis revealed significant reduction of Oil Red staining from OF treatment, each dot represent 10 larvae. B, The anti‐lipid accumulation effect of fucoidan in a 15‐day‐old CD36 transgenic fish model revealed by LipidGreen staining from CD36 transgenic fish fed with 24% high fat diet without or with fucoidan. The statistical analysis revealed significant reduction of lipid‐green staining from OF treatment, each dot represents 1 larva. C, The anti‐HCC effect of oligo‐fucoidan in a 1‐month‐old CD36 transgenic fish model revealed by H&E staining. CD36 transgenic fish fed with 24% high fat diet without and with fucoidan. Statistical analysis of H&E stain revealed significant reduction of steatosis and HCC formation upon OF treatment. D, Oligo‐fucoidan reduced the protein levels of PCNA proliferation marker in hepatic tissues of CD36 transgenic zebrafish fed by high fat diet and OF. Statistical analysis of PCNA IHC stain revealed significant reduction of PCNA nuclear staining upon OF treatment. E, The gene expression profiles of the selected marker genes of lipogenesis, cholesterol synthesis, inflammation, ER stress, and cell proliferation of oligo‐fucoidan treatment in a 1‐month‐old CD36 transgenic fish model. Statistical significance was calculated by t‐test: *< .05, ***P ≤ .001; ****P ≤ .0001.

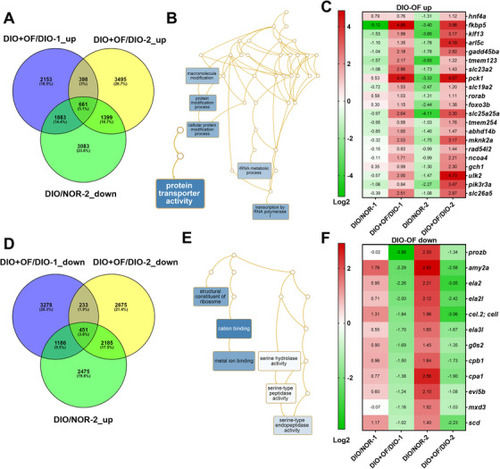
Pathways analysis for the differential expressed genes in [HBx,src], and [HBx,src,p53−/+] transgenic zebrafish following oligo‐fucoidan treatment. A, Venn diagram of genes was upregulated in oligo‐fucoidan pretreatment but downregulated by DIO and carcinogens. B, Network analysis of oligo‐fucoidan induced genes. C, The heatmap of top 21 oligo‐fucoidan upregulated genes. D, Venn diagram of genes was downregulated in oligo‐fucoidan pretreatment but up‐regulated by DIO and carcinogens. E, Network analysis of oligo‐fucoidan downregulated genes. F, The heatmap of top 12 oligo‐fucoidan downregulated genes.

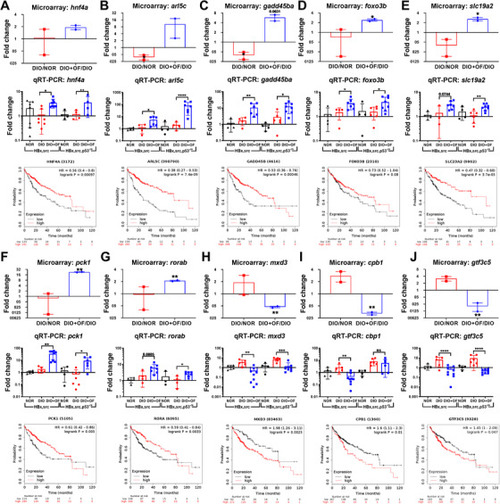
Validate the microarray data with qPCR for the five genes upregulated by OF (A‐G), and three genes downregulated by OF (H–J) in [
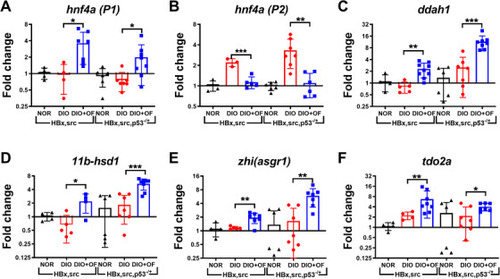
HBx,src] and [HBx,src,p53−/+] transgenic zebrafish. The OF upregulated and downregulated genes from microarray and survival probability in liver cancer patients according to The Cancer Genome Atlas (TCGA) database. A‐G, Genes were upregulated by oligo‐fucoidan correlated to prolong survival rate in HCC patients. H‐J, Genes were downregulated by oligo‐fucoidan, and their expression correlated to poorer survival rate in HCC patients. Statistical significance was calculated by t‐test: *P ≤ .05, **P ≤ .01, ***P ≤ .001.

Upregulation of hnf4a‐P1, downregulation of hnf4a‐P2, and increased expression of ddah1, 11b‐hsd1, asgr1, and tdo2a in zebrafish. Gene expression profiles of hnf4a‐P1, hnf4a‐P2, ddah1, 11b‐hsd1, zhi(asgr1), and tdo2a, in [HBx,src] and [HBx,scr,p53−/+] transgenic fish with normal diet (NOR), diet‐induced obesity promoting HCC (DIO) and oligo‐fucoidan treatment (DIO+OF) were shown. Statistical significance was calculated by t‐test: *P ≤ .05, **P ≤ .01, ***P ≤ .001.

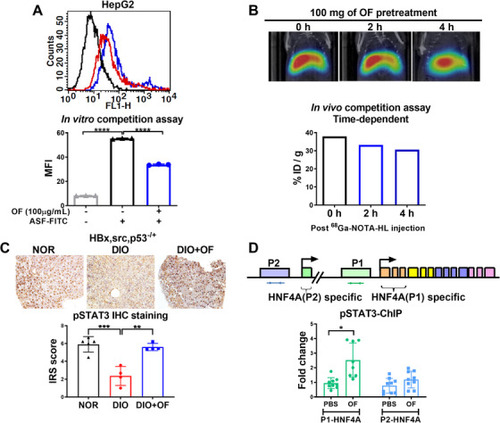
Oligo‐fucoidan binds to ASGR1/2 in hepatoma cells, enhances pSTAT3 in hepatic tissues of [HBx,src,p53−/+] transgenic fish, and enriches pSTAT3 binding to P1‐HNF4A promoter in hepatoma cells. A, Flow cytometry profiles of HepG2 cells. The mean fluorescence intensity (MFI) profiles of HepG2 cells with OF treatment. The asialofetuin‐FITC (ASF‐FITC) signals were presented in the control (black), without OF co‐treatment (blue) and with OF co‐treatment. B, The reduction of 68Ga‐NOTA‐HL radioactivity intensity in a time‐dependent manner was depended on the administration of OF (N = 1). Relative radioactive intensity of 68Ga‐NOTA‐HL in vivo between different time courses. Black bar indicates post‐68Ga‐NOTA‐HL injection 0 hour, blue and red bar denote post‐68Ga‐NOTA‐HL injection 2 hours and 4 hours, respectively. C, Immunohistochemistry staining of pSTAT3 in [HBx,src,p53−/+] transgenic fish fed with normal diet (NOR), diet‐induced obesity (DIO) or treated with oligo‐fucoidan (DIO+OF). Semi‐quantitative analysis of pSTAT3 staining in hepatic tissues from [HBx,src,p53−/+] transgenic zebrafish. Statistical significance was calculated by t‐test: **P ≤ .01, ***P ≤ .001. D, The expression fold of chromatin immunoprecipitation (ChIP) of pSTAT3 binding to P1‐HNF4A promoter in HepG2 cells was enriched by OF treatment. Statistical significance was calculated by t‐test: *P ≤ .05, **P < .01, ***P ≤ .001; **** P ≤ .0001.

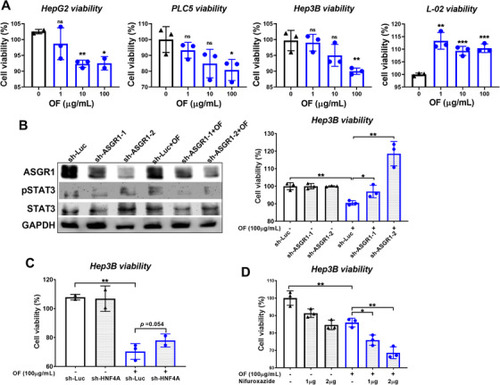
Knockdown of ASGR and HNF4A reverses the effect of oligo‐fucoidan reduced the hepatoma cell viability. A, Oligo‐fucoidan reduced the cell viability of three hepatoma cells. B, Western blot analysis indicating that knockdown of ASGR by sh‐ASGR1‐1 and sh‐ASGR1‐2 reduced the ASGR protein level and pSTAT3. Cell viability assay demonstrated that OF treated for 48 hours significantly reduced cell proliferation and sh‐ASGR1‐1 and sh‐ASGR1‐2 significantly reversed the OF effect. C, Knockdown of HNF4A by sh‐HNF4A reverse the OF inhibiting hepatoma cell viability. D, STAT3 inhibitor synergize with oligo‐fucoidan on reduction of hepatoma cell viability.

Acknowledgments
This image is the copyrighted work of the attributed author or publisher, and ZFIN has permission only to display this image to its users. Additional permissions should be obtained from the applicable author or publisher of the image. Full text @ Clin Transl Med