
- Title
-
Tuning apicobasal polarity and junctional recycling in the hemogenic endothelium orchestrates the morphodynamic complexity of emerging pre-hematopoietic stem cells
- Authors
- Torcq, L., Majello, S., Vivier, C., Schmidt, A.A.
- Source
- Full text @ Elife
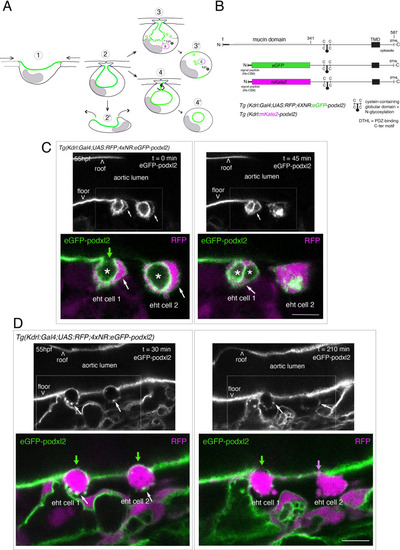
Tracing the evolution of the luminal membrane using the polarity marker Podocalyxin points at the biological significance of apicobasal polarity establishment in EHT cell emergence complexity. (A) Cartoons depicting the early and late steps of EHT cells emerging from the aortic floor (steps 1 and 2, as previously described in the zebrafish embryo, see Kissa and Herbomel, 2010; Lancino et al., 2018) and with hypothetical evolution of the luminal membrane (in green) before (3 and 4) and after the release 2’, the cell detaches from the endothelial layer via junction downregulation leading to exposure of the luminal membrane with le extracellular milieu; 3’, the luminal membrane is consumed via endocytic recycling (E) and/or lysosomal degradation (Lys) prior to detachment; 4’, the luminal membrane in 4 is released inside the cell (twisted arrow) before detachment. Grey area = nucleus. (B) PodocalyxinL2 (Podxl2) construct designed to establish transgenic fish lines. Cartoons representing full length (top drawing) and deleted Podxl2 (amino-acid sequence 341–587) in which the mucin domain (serine/threonine-rich O-glycosylation domain) is replaced by either eGFP or mKate2. The tetracystein-containing globular domain (subjected to N-glycosylation) was kept as favoring apical membrane retention. TMD, transmembrane domain; DTHL, (C)-terminal peptidic motif involved in partnership with PDZ domain containing proteins. (C, D) EHT performing cells visualized using Tg(Kdrl:Gal4;UAS:RFP;4xNR:eGFP-podxl2) embryos and time-lapse sequences initiated at 55 hpf obtained with spinning disk confocal microscopy (imaging was performed at the boundary between the most downstream region of the AGM and the beginning of the caudal hematopoietic tissue). Top grey panels show the green, eGFP channels for eGFP-podxl2 only. Bottom panels show the merge between green and red (soluble RFP, in magenta) channels. Scale bars = 8 µm. (C) Single plane images of 2 EHT pol+ cells extracted from a time-lapse sequence at t=0 and t=45 min, with the right cell (eht cell 2) more advanced in the emergence process than the left one (eht cell1). Note the enrichment of eGFP-podxl2 at the luminal membrane (surrounding the cavity labeled with an asterisk) in comparison to the basal membrane (white arrow). Note also the evolution of the luminal membranes with time, with the aortic and eht cell 1 lumens still connecting at t=0 (green arrow), the apparent fragmentation of the cytosolic vacuole (2 asterisks for eht cell 1 at t=45 min) and the compaction of Podxl2-containing membranes for eht cell 2 at t=45 min. More details on the evolution of the connection between the aortic/eht cell lumens are shown in Figure 1—figure supplement 1A. (D) Single plane images of 2 EHT pol- cells extracted from a time-lapse sequence at t=30 min and t=210 min (see Figure 1—video 3 for the full-time lapse sequence), with the right cell (eht cell 2) slightly more advanced in the emergence than the left one (eht cell 1, with the latest attachment point between the emerging cell and the aortic floor (pink arrow)). Note, in comparison with the cells in panel (C), the ovoid shapes of cells, the absence of enrichment of eGFP-podxl2 at luminal membranes (green arrows) and the accumulation of eGFP-podxl2 at basal membrane rounded protrusions (white arrows). |
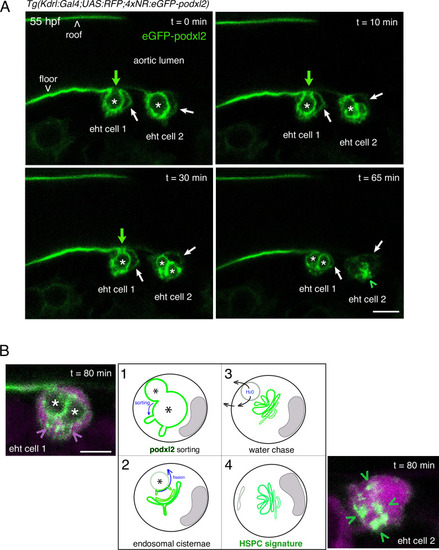
Evolution of the apical/luminal membrane throughout time. ( |
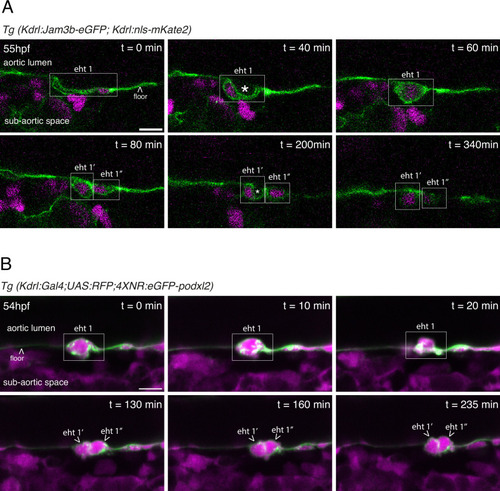
EHT pol+ and EHT pol- cells recover their respective morphology after mitosis. ( |
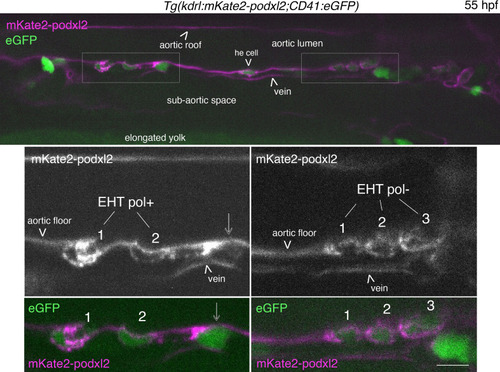
EHT pol+ and EHT pol- cells express eGFP driven by the CD41 promotor. Single z-plane of a 55 hpf |
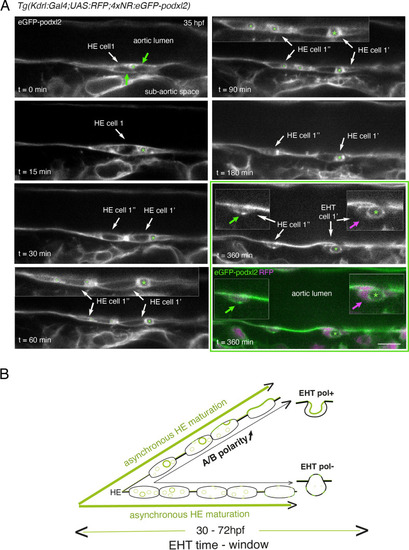
Immature HE is not polarized and controls membrane delivery of intra-cytosolic vesicular pools. (A) Tg(Kdrl:Gal4;UAS:RFP;4xNR:eGFP-podxl2) embryo imaged using spinning disk confocal microscopy. Black and white images show eGFP-podxl2 only. Images (single z-planes) were obtained from a time-lapse sequence (initiated at 35 hpf) lasting for 435 min (7.25 hr), with intervals of 15 min between each z-stack. Example of an HE cell with equal partitioning of eGFP-podxl2 between luminal and abluminal membranes (at t=0 min), with eGFP-podxl2 containing intra-cytosolic vesicles (one labeled with a green asterisk) and undergoing mitosis at t=30 min (HE cell 1’ and HE cell 1’’ are daughter cells). Note the inheritance of the largest micropinocytic-like vacuole by HE cell 1’ and its maintenance over time until EHT emergence initiation at t=180 min (green asterisk in 1.5 x magnified areas at t=60 and 90 min). At t=360 min (green box) EHT is proceeding and both fluorescence channels are shown; bottom panel: green (eGFP-podxl2), magenta (soluble RFP). The magenta arrow points at the basal side of the EHT pol+ cell (EHT cell 1’, on the right) that does not contain any detectable eGFP-podxl2; on the contrary, eGFP-podxl2 is enriched at the luminal/apical membrane (note that exocytosis of the large vacuolar structure may have contributed to increase the surface of the apical/luminal membrane [the green asterisk is surrounded by the apical/luminal membrane of the EHT pol+ cell]). The green arrow points at the abluminal membrane of the EHT cell derived from HE cell 1’’ (EHT cell 1’’) and that contains eGFP-podxl2 (with no evidence of a significant expansion of a luminal/apical membrane); this indicates that this cell is more likely to be an EHT pol- cell that did not sort the vesicular cargo to the luminal/apical membrane. Scale bar = 10 µm. (B) Hypothetical model summarizing the evolution of HE cells involving the tuning of apicobasal polarity to lead to cells competent for giving birth to either EHT pol+ or EHT pol- cells (including the release of large vesicular macropinocytic-like vacuoles preferentially toward the luminal membrane of future EHT pol+ cells). The polarity status of HE cells is proposed to evolve asynchronously throughout the entire EHT time window, leading to place-to-place ability to give birth to EHT cells (emergence of EHT pol+ and EHT pol- cells are both observed until 72 hpf, see main text). |
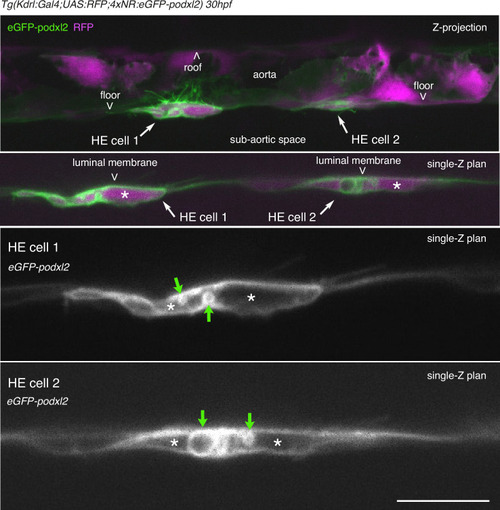
HE cells are not polarized at 30 hpf. |
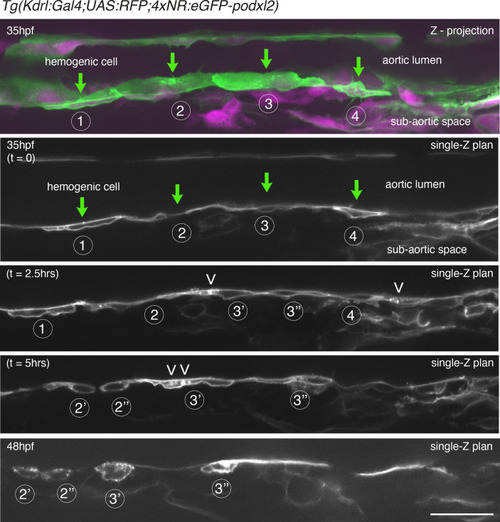
Evolution of non-polarized HE cells throughout emergence. |
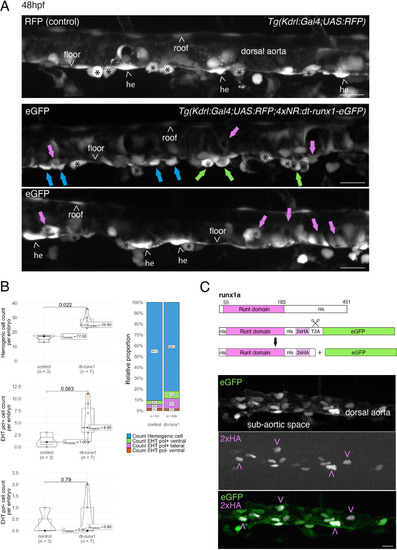
Interference with Runx1 function alters emergence efficiency and induces a bias toward EHT pol+ cells. (A) Tg(kdrl:Gal4;UAS:RFP;4xNR:dt-runx1-eGFP) mutant embryos imaged using spinning disk confocal microscopy and analyzed in the AGM/trunk region. Z-projections of the dorsal aorta obtained from 52 to 55 hpf embryos. Top panel: fluorescence from the red channel is shown for the Tg(Kdrl:Gal4;UAS:RFP) control. Bottom panels: fluorescence in the green channel only is shown for the mutants (eGFP, released from the dt-runx1-eGFP cleavage). The black asterisks point at emerged cells that are in close contact with the aortic floor. Green arrows: EHT pol+ cells on aortic floor; magenta arrows: EHT pol+ cells in the lateral aortic wall; blue arrows: uncharacterized emerging cells; he: hemogenic cells. Scale bars = 20 µm. (B) Quantitative analysis of the dt-runx1 mutant phenotype. The analysis was carried out on Tg(Kdrl:Gal4;UAS:RFP) control embryos (n=3) and on Tg(kdrl:Gal4;UAS:RFP;4xNR:dt-runx1-eGFP) mutant embryos (n=7). Left top: hemogenic cell count (comprising hemogenic cells, labeled by ‘he’ on panel (A) as well as uncharacterized emerging cells, labeled by blue arrows on panel (A)). Left center: EHT pol+ cell count (sum of EHT pol+ cells emerging ventrally and laterally, respectively labeled by green and magenta arrows on panel (A)). Left bottom: EHT pol- cell count not shown on panel (A). Right: percentage of cell types in control and dt-runx1 embryos (proportions relative to total number of hemogenic and EHT undergoing cells). Statistical comparisons have been performed using two-sided unpaired Wilcoxon tests, all p-values are displayed. (C) Top: cartoons representing the zebrafish full-length runx1a amino acid sequence and the dt-runx1 mutant deleted from the trans-activation domain and of the C-terminus note that the construct encodes for a C-terminal fusion with eGFP that is released upon expression via a cleavable T2A peptide (introduced between the 2xHA tag and the N-terminus of eGFP, to prevent from potential steric hindrance). nls, nuclear localization signal. Bottom: image of an anti-HA tag immunofluorescence obtained after z-projection of the dorsal aorta of a 50 hpf Tg(dt-runx1) embryo. Note the localization of the 2xHA-tagged dt-runx1 protein in nuclei (some of them are pointed by red arrowheads) and of eGFP in nuclei and the cytosol of aortic cells. Scale bar = 25 µm. Raw images (z-stacks) for this figure (dt-runx1 phenotype analysis) are available at https://doi.org/10.5281/zenodo.10932245. |
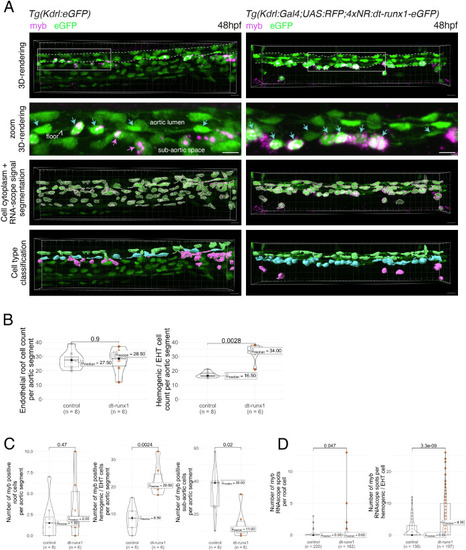
Expression of dt-runx1 triggers the accumulation of myb + cells in the aortic floor. ( |
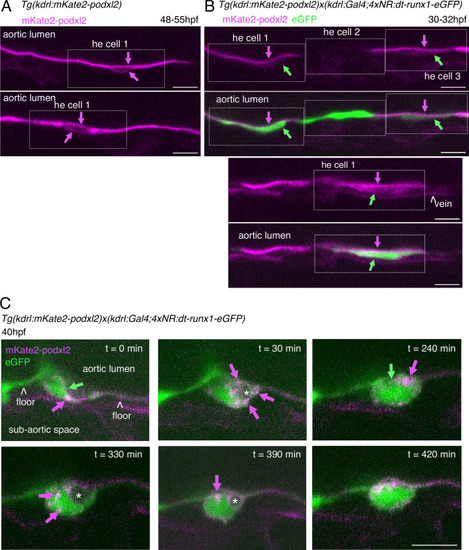
Phenotypic analysis of dt-runx1 expressing mutants: evidence for apicobasal polarity of hemogenic cells. 30–32 hpf and 48 - 55hpf embryos obtained from |
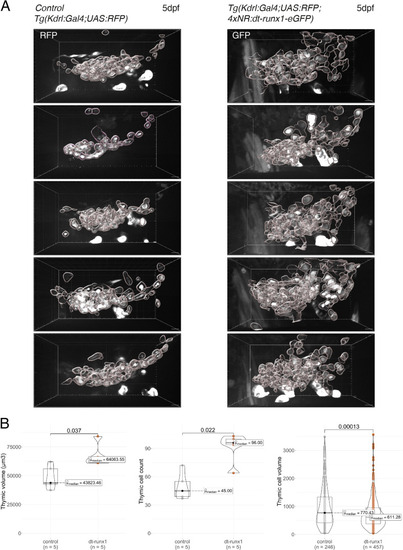
Phenotypic analysis of dt-runx1 expressing mutants: expansion of the thymus. ( |
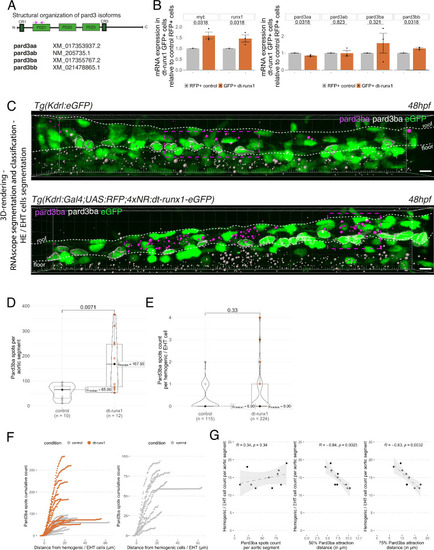
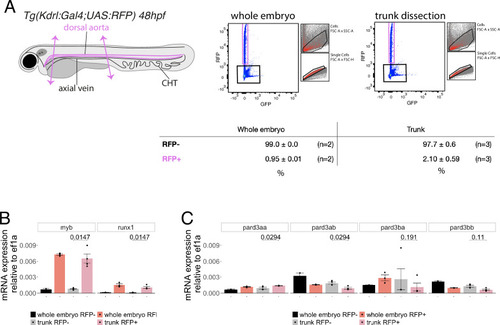
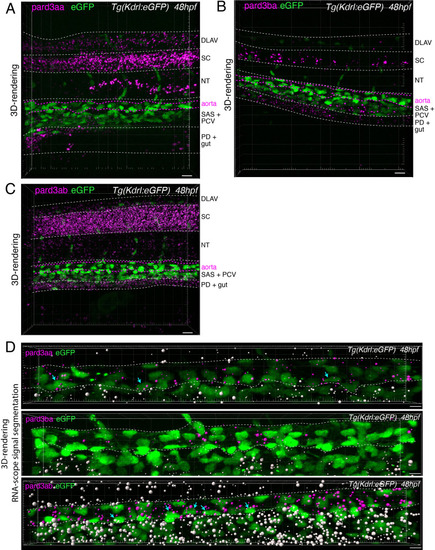
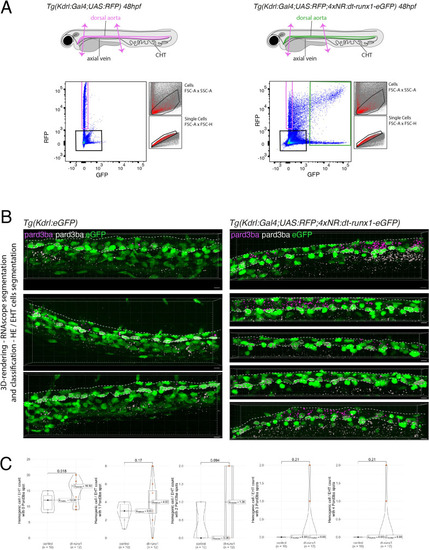
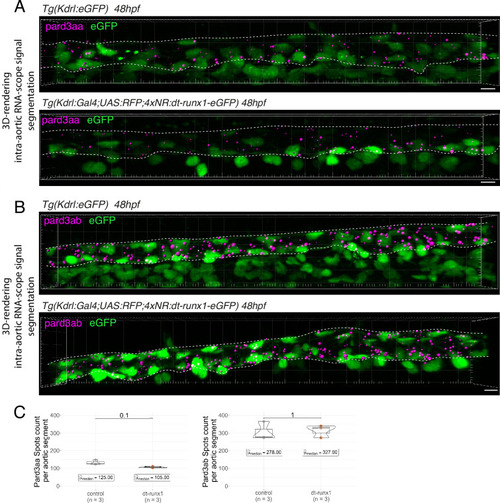
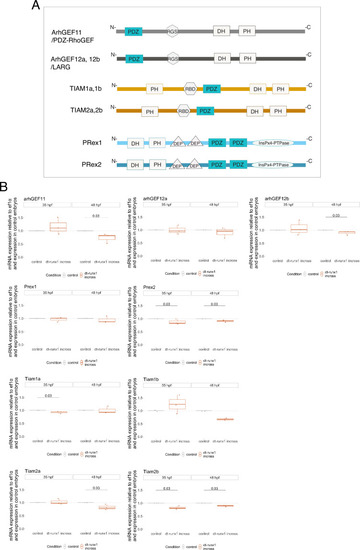
Pard3ba expression is highly sensitive to interference with Runx1 activity. (A) Pard3aa, ab, ba, and bb zebrafish gene products, with their accession numbers. The cartoon represents the common structures of the four proteins, with the three sequential PDZ domains (PDZ1-3), and the CR1 and CR3 conserved regions involved in oligomerization and atypical protein kinase C (aPKC) binding, respectively. The magenta arrows show the positioning of qRT-PCR primers, located in the PDZ1 domain (see Materials and ethods for primer sequences). (B) qRT-PCR analysis of genes expression levels of (left) the hematopoietic markers myb and runx1, (right) the four Pard3 mRNAs (encoding for Pard3aa, ab, ba, and bb) in cell populations isolated from FACS-sorted trunk vascular cells of 48–50 hpf control and mutant embryos (see Figure 4—figure supplement 1, Figure 4—figure supplement 2 and Materials and methods for cell isolation procedures). Graphs show the measured mean fold changes relative to the expression of ef1α and to the expression in RFP+ control cells. Statistical tests: two-sided unpaired two samples Wilcoxon test, all p-values are displayed. Analysis was carried out on n=3 for control and mutant conditions. (C) Representatives images (Imaris 3D-rendering) of RNAscope in situ hybridizations for Pard3ba in 48–50hpf Tg(Kdrl:eGFP) control embryos and Tg(Kdrl:Gal4;UAS:RFP;4xNR:dt-runx1-eGFP) mutant embryos. The aorta is outlined with the white dashed lines. The RNAscope signal was segmented into spots and classified based on its localization: in aortic endothelial and hemogenic cells (magenta spots) or in extra-aortic tissues (grey spots, essentially residing in the sub-aortic space). Magenta dashed boxes delineate examples of mRNA Enriched Regions (MERs) in control and mutant embryos. Scale bars = 10 µm. (D) Pard3ba spots count per aortic segment. (E) Pard3ba spots count per hemogenic/EHT cells. (F) Cumulative Pard3ba spots count relative to hemogenic/EHT cell distance, averaged for each aortic segment, in control embryos (grey) and dt-runx1 mutant embryos (orange). (G) HE/EHT cell count relative to number of spots, all expressed per aortic segment (left), 50% Pard3ba spots attraction distance (in µm) (middle) or 75% Pard3ba spots attraction distance (in µm) (right). 50%/75% spots attraction distance corresponds to the distance from hemogenic/EHT cells within which 50%/75% of Pard3ba spots are located. Grey dash lines correspond to regression lines and light grey background correspond to the confidence interval (95%) of the regression model. Linear correlation coefficient (R, Pearson correlation) is displayed for each condition. For (D and E), statistical tests: two-sided unpaired two samples Wilcoxon test, all p-values are displayed. Analysis was carried out on n=5 control embryos and n=6 mutant embryos, 2 aortic segments per embryos. For (G) p-values were calculated using a t-test. Raw images (z-stacks) for this figure and Figure 4—figure supplement 3 (Pard3 mRNA expression in control and mutant conditions) are available at https://doi.org/10.5281/zenodo.10937428. |
Expression levels of Pard3 mRNAs in FACS-sorted endothelial cells. ( |
Localization of Pard3 mRNAs using RNAscope. ( |
Expression of Pard3ba is upregulated by dt-Runx1. ( |
Expression of Pard3aa and Pard3ab are insensitive to dt-Runx1. ( |
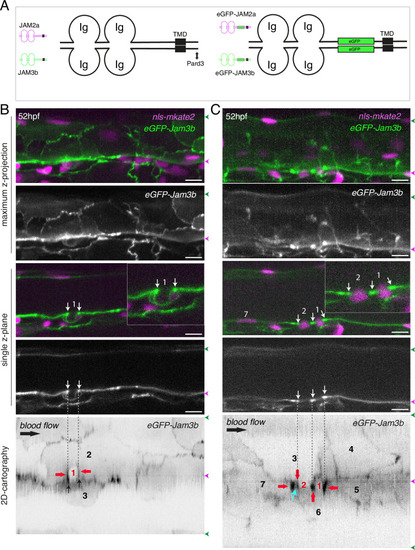
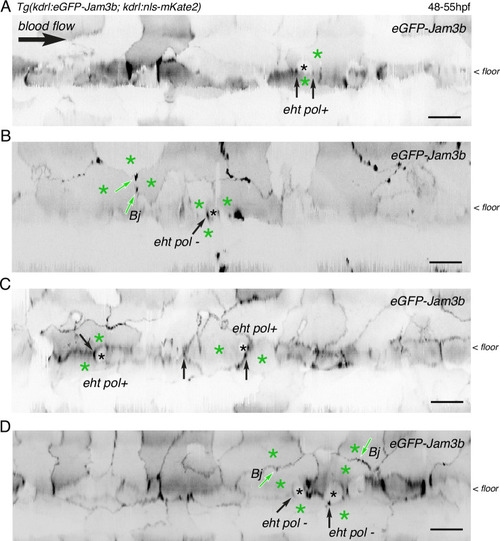
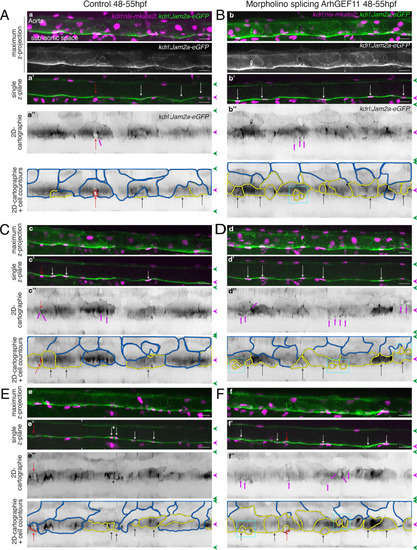
eGFP-Jam3b localization is reinforced at antero-posterior sites of the endothelial/EHT interface and at tri-cellular junctions. (A) Cartoons representing homodimers of full-length JAMs with the C-terminal cytosolic part interacting with Pard3 (JAMs interact with the first PDZ domain of Pard3) as well as the constructs generated in this study and containing eGFP inserted between the Immunoglobulin-like (Ig) domains and the trans-membrane region (TMD). The constructs were obtained for zebrafish JAM2a and JAM3b. (B, C) 52 hpf Tg(kdrl:eGFP-Jam3b; kdrl:nls-mKate2) embryos were imaged in the trunk region (AGM) using spinning disc confocal microscopy. The panels are either maximum z-projections (top two) or single plane z-sections (bottom two, focusing on the aortic floor) of aortic segments, with either the merged nls-mkate2 and eGFP-Jam3b fluorescence signals (magenta and green) or the eGFP-Jam3b signal only (black and white images). Bottom of the figure: 2D-cartographies obtained after deploying aortic cylinders and showing the eGFP-Jam3b signals only. The white/black vertical dashed lines show the correspondence of the antero-posterior junctional reinforcements in the single z-sections (white arrows) on the respective 2D-cartographies resulting from the deployment of the aortic walls (obtained from the z-stacks). (B) Example of an EHT pol+ cell (cell 1, white arrows point at reinforcement of signal at antero-posterior junctions). On the 2D cartography, cell 1 (red) is contacting endothelial cells 2 and 3; note the reinforcement of eGFP-Jam3b signals along antero-posterior membrane interfaces perpendicular to blood flow (red arrows) as well as at the two tri-cellular junctions visible between cells 1, 2 and 3 (black arrows). (C) Example of two EHT pol- cells (cells 1 and 2, white arrows point at reinforcement of signal at antero-posterior junctions). On the 2D cartography, cells 1 and 2 (red) are contacting endothelial cells 3, 4, 6 and 3, 6 respectively; note the reinforcement of eGFP-Jam3b signals along antero-posterior membrane interfaces perpendicular to blood flow (red arrows) and endothelial cell 6 that has intercalated between endothelial cell 7 and EHT pol- cell 2 (blue arrow). In right margins, magenta and green arrowheads designate the aortic floor and roof, respectively. Scale bars = 10 µm. |
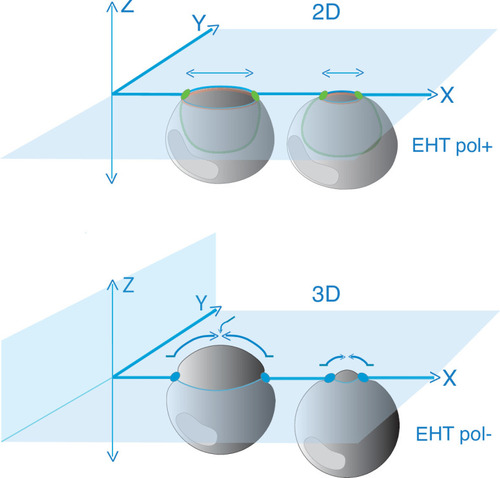
Model depicting the evolution of junctional interfaces and of the differential mobility of antero-posterior junctional complexes for EHT pol+ and EHT pol- cell emergence types. Top panel: EHT pol+ cell whose emergence depends on the constriction of circumferential actomyosin (orange, see |
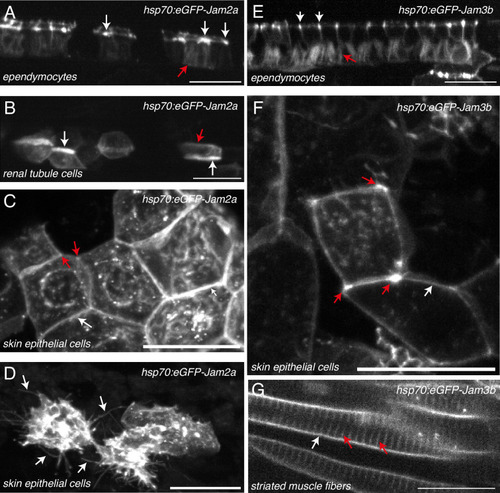
JAM2a and JAM3b expression and localization in diverse embryonic tissues. Localization of transiently expressed eGFP-Jam2a ( |
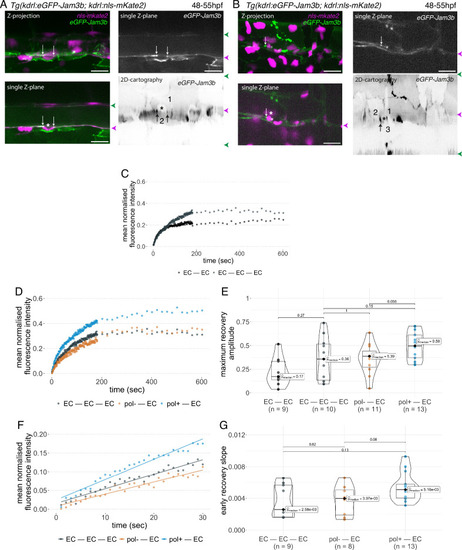
Junctional recycling at tri-cellular contacts is differentially controlled between the two EHT types. Forty-eight to 55 hpf Tg(kdrl:eGFP-Jam3b; kdrl:nls-mKate2) embryos were imaged using spinning disc confocal microscopy and illuminated for Fluorescence Recovery After Photobleaching (FRAP) in the trunk region (AGM, Aorta Gonad Mesonephros). (A, B) Panels are either maximum z-projections (top left) or single plane z-sections (bottom left and top right, focusing on the aortic floor) of aortic segments, with either the merged nls-mkate2 and eGFP-Jam3b fluorescence signals (magenta and green) or the eGFP-Jam3b signal only (black and white images). White arrows point at reinforcement of signal at antero-posterior junctional pools of an EHT pol+ cell (A) or of an EHT pol- cell (B), both marked by asterisks. Bottom right: 2D-cartographies obtained after deploying aortic cylinders and showing the eGFP-Jam3b signals only. Black arrows point at antero-posterior junctional pools, in particular at tri-junctional regions that exhibit increase in signal density (well visible in A black arrows). 2 and 3 endothelial cells are contacting the EHT pol+ cell (A) and the EHT pol- cell (B), respectively. In right margins, magenta and green arrowheads designate the aortic floor and roof, respectively. Scale bars = 20 µm. (C—G) FRAP analyses. EGFP-Jam3b junctional pools corresponding to the brightest spots inside junctional regions of interest were bleached for FRAP measurements (these high intensity pools were localized at the level of bi- and tri-junctions for endothelial cells (EC) and in tri-junctional regions for EHT pol+ and EHT pol- cells; all these junctional pools were systematically visualized by deploying each aortic segment before bleaching as shown in the 2D-cartographies in A and B as well as in Figure 6—figure supplement 1, see also Materials and methods). FRAP analysis concerned three types of junctional interfaces: between endothelial cells (EC – EC, black and grey), EHT pol- and endothelial cells (pol- – EC, brown), EHT pol+ and endothelial cells (pol+ – EC, blue). (C, D) Evolution of mean fluorescence intensity for each type of junctional interface over time (10 min), after photobleaching (t=0 s). (E) Median maximum amplitude of recovery of all determinations and for each type of junctional interface (maximum of simple exponential fitted curves). (F, G) Early fluorescence recovery. Early evolution (over the first 30 s) of the mean fluorescence intensity for each type of junctional interface over time after photobleaching (t=0 s). (F) The fitted lines correspond to linear regressions of mean fluorescence intensities. (G) Median values of fluorescence recovery slopes (linear regressions) of all determinations and for each type of junctional interface. (E, G) The number of biological replicate (n) is stated on the plots. Statistical tests: two-sided unpaired two samples Wilcoxon test. |
Examples of junctional contacts targeted by FRAP in the aortic landscape. After performing z-stack acquisitions in trunk regions followed by 2D-deployment of aortic segments ( |
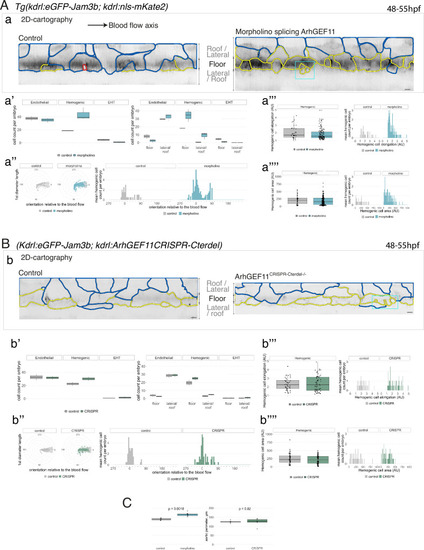
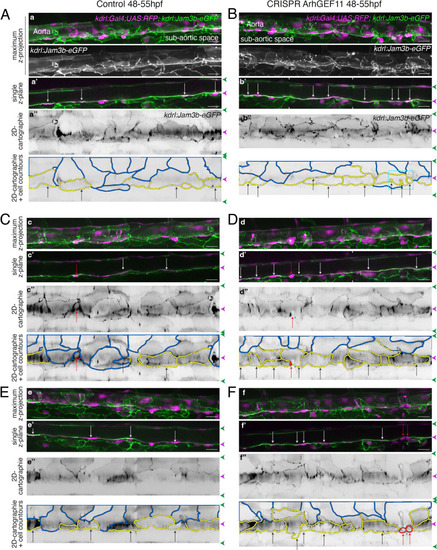
Interfering with ArhGEF11/PDZ-RhoGEF function leads to the accumulation of hemogenic cells and impairs EHT progression. (A-C) Numeration and morphometric analyses of aorta and cell types for Tg(kdrl:eGFP-Jam3b; kdrl:nls-mKate2) ArhGEF11 exon 38 splicing morpholino-injected and control embryos (A), or for (Kdrl:eGFP-Jam3b; kdrl:ArhGEF11CRISPR-Cterdel+/+) homozygous ArhGEF11 C-ter deletion mutants and control siblings. (B) Forty-eight to 55 hpf embryos were imaged using spinning disk confocal microscopy. (Aa, Bb) 2D-cartographies obtained after deploying aortic cylinders and showing the eGFP-Jam3b signals only with cell contours delineated either in blue (endothelial cells), yellow (hemogenic cells, see Materials and methods for their morphological definition), red (morphologically characterized EHT cells, for controls), and small cells delineated by cyan boxes (morphologically uncharacterized EHT cells and putative post-mitotic cells remaining as pairs, included in the numeration as hemogenic cells). Cellular contours have been semi-automatically segmented along the cellular interfaces labeled with eGFP-Jam3b (see Materials and methods). Scale bars: 10 µm. (Aa’, Bb’) Left: numeration of endothelial, hemogenic and EHT-undergoing cells according to the position of their geometrical center (either on the aortic floor, or on the roof, or on the lateral side), for each condition; right: number of endothelial, hemogenic and EHT-undergoing cells in each condition calculated from the segmentation of 3x2D-projections per embryo and covering the entire aortic regions in the trunk. (Aa’’, Bb’’) Left: length of hemogenic cells (in the longest axis) in function of their orientation (°) relative to the blood flow axis (0–180°); right: distribution of the orientation of hemogenic cells relative to the blood flow axis, displayed as a mean distribution of cells per embryo. (Aa’’’, Bb’’’) Hemogenic cell elongation factors in arbitrary Units (scale factor given by the ratio between the first- and the second-best fitting ellipse diameters, the minimum value being 1 for a non-elongated object) represented as boxplot distribution of all segmented cells (left) or as the distribution of cell elongation factor per embryo (right), for controls and for interfering conditions as indicated. (Aa’’’’, Bb’’’’) Hemogenic cell area represented as boxplot distribution of all segmented cells (left) or as the distribution of cell area per embryo (right), for controls and for interfering conditions as indicated. (C) Aaortic perimeter (in µm) for controls and mutant conditions as indicated. Statistical tests: two-sided unpaired two samples Wilcoxon test. For the ArhGEF11 exon 38 splicing morpholino condition, analysis was performed on 2 x control (non-injected embryos) and 3 x embryos injected at the one-cell stage; for the CRISPR mutant condition, analysis was performed on 2 x wild-type siblings for control and 2 x homozygous mutant embryos whose DNA mutation was confirmed by sequencing. Three consecutive aortic segments per embryo were analyzed to cover the whole length of the dorsal aorta, in the trunk region (covering a distance of 990 µm per embryo). Raw images (z-stacks and 2D cartographies) for panel (A) and Figure 7—figure supplement 5 (morphometric analysis of aortic cells in control and ArhGEF11 morpholino splicing conditions) are available at https://doi.org/10.5281/zenodo.10937430. Raw images (z-stacks and 2D cartographies) for panel (B) and Figure 7—figure supplement 6 (morphometric analysis of aortic cells in control and ArhGEF11 CRIPSR mutant conditions) are available at https://doi.org/10.5281/zenodo.10937434. |
Searching for PDZ-domain containing RhoGEFs potentially involved in the EHT. ( |
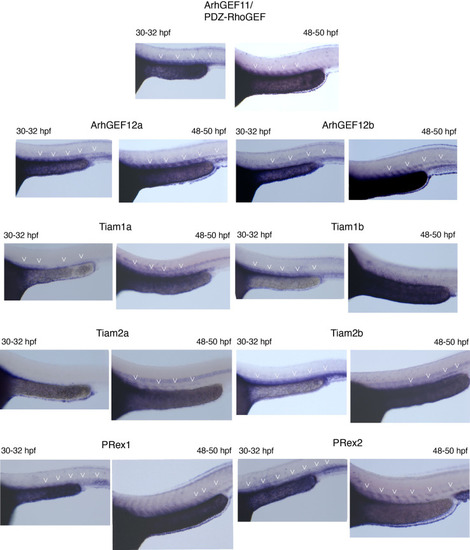
Whole mount in situ hybridizations (WISH) performed on 30–32 hpf and 48–50 hpf embryos, with probes specific for all nine PDZ-domain containing RhoGEFs that were investigated in this study. Note that all RhoGEFs are detected in the dorsal aorta of the trunk region (white arrowheads). |
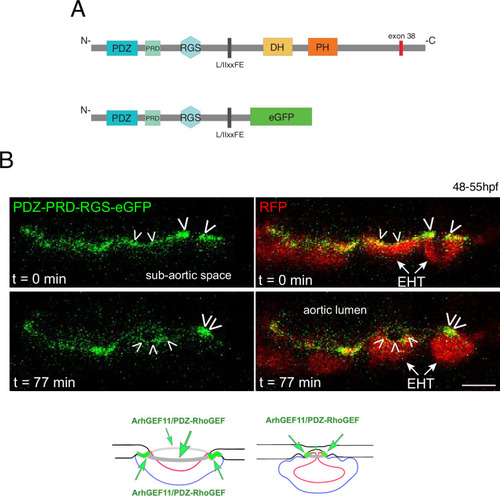
A N-terminal fragment of ArhGEF11/PDZ-RhoGEF localizes at junctional membranes with enrichment at antero-posterior sites of EHT cells. ( |
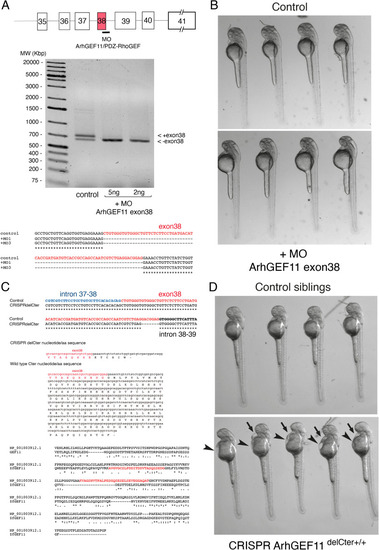
MO and CRISPR approaches to investigate the function of ArhGEF11/PDZ-RhoGEF in the EHT. ( |
Supplementary data on the ArhGEF11/PDZ-RhoGEF exon 38 splicing morpholino phenotype. |
Supplementary data on the ArhGEF11/PDZ-RhoGEF CRISPR C-ter deletion phenotype. ( |
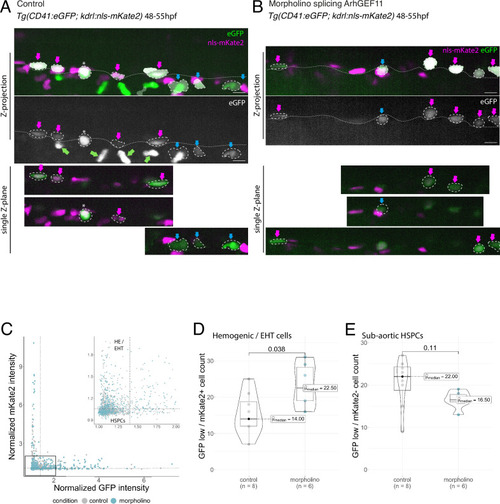
MO interference with ArhGEF11 exon 38 splicing leads to the accumulation of CD41 positive cells in the aortic floor and negatively impacts on the generation of hematopoietic precursors. ( |
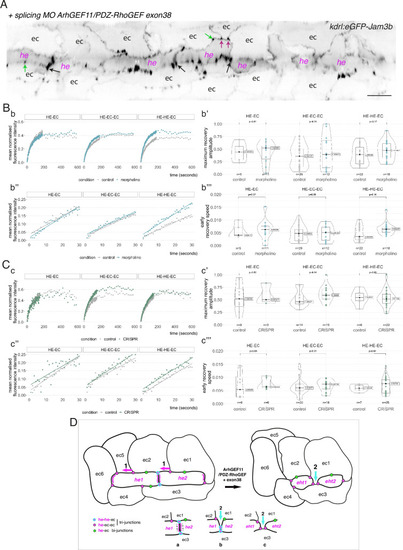
Interfering with the function of ArhGEF11/PDZ-RhoGEF suggests an activity at the interface between endothelial and hemogenic cells that relies on restricting the mobility of junctional pools at tri-cellular junctions, with a prominent role of the +exon 38 variant during endothelial cell intercalation. ( |