
Figure 3
- ID
- ZDB-FIG-240531-94
- Publication
- Torcq et al., 2024 - Tuning apicobasal polarity and junctional recycling in the hemogenic endothelium orchestrates the morphodynamic complexity of emerging pre-hematopoietic stem cells
- Other Figures
-
- Figure 1
- Figure 1—figure supplement 1.
- Figure 1—figure supplement 2.
- Figure 1—figure supplement 3.
- Figure 2
- Figure 2—figure supplement 1.
- Figure 2—figure supplement 2.
- Figure 3
- Figure 3—figure supplement 1.
- Figure 3—figure supplement 2.
- Figure 3—figure supplement 3.
- Figure 4
- Figure 4—figure supplement 1.
- Figure 4—figure supplement 2.
- Figure 4—figure supplement 3.
- Figure 4—figure supplement 4.
- Figure 5
- Figure 5—figure supplement 1.
- Figure 5—figure supplement 2.
- Figure 6
- Figure 6—figure supplement 1.
- Figure 7
- Figure 7—figure supplement 1.
- Figure 7—figure supplement 2.
- Figure 7—figure supplement 3.
- Figure 7—figure supplement 4.
- Figure 7—figure supplement 5.
- Figure 7—figure supplement 6.
- Figure 7—figure supplement 7.
- Figure 8.
- All Figure Page
- Back to All Figure Page
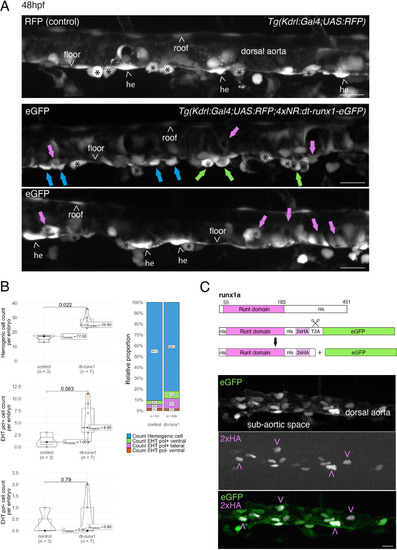
Interference with Runx1 function alters emergence efficiency and induces a bias toward EHT pol+ cells. (A) Tg(kdrl:Gal4;UAS:RFP;4xNR:dt-runx1-eGFP) mutant embryos imaged using spinning disk confocal microscopy and analyzed in the AGM/trunk region. Z-projections of the dorsal aorta obtained from 52 to 55 hpf embryos. Top panel: fluorescence from the red channel is shown for the Tg(Kdrl:Gal4;UAS:RFP) control. Bottom panels: fluorescence in the green channel only is shown for the mutants (eGFP, released from the dt-runx1-eGFP cleavage). The black asterisks point at emerged cells that are in close contact with the aortic floor. Green arrows: EHT pol+ cells on aortic floor; magenta arrows: EHT pol+ cells in the lateral aortic wall; blue arrows: uncharacterized emerging cells; he: hemogenic cells. Scale bars = 20 µm. (B) Quantitative analysis of the dt-runx1 mutant phenotype. The analysis was carried out on Tg(Kdrl:Gal4;UAS:RFP) control embryos (n=3) and on Tg(kdrl:Gal4;UAS:RFP;4xNR:dt-runx1-eGFP) mutant embryos (n=7). Left top: hemogenic cell count (comprising hemogenic cells, labeled by ‘he’ on panel (A) as well as uncharacterized emerging cells, labeled by blue arrows on panel (A)). Left center: EHT pol+ cell count (sum of EHT pol+ cells emerging ventrally and laterally, respectively labeled by green and magenta arrows on panel (A)). Left bottom: EHT pol- cell count not shown on panel (A). Right: percentage of cell types in control and dt-runx1 embryos (proportions relative to total number of hemogenic and EHT undergoing cells). Statistical comparisons have been performed using two-sided unpaired Wilcoxon tests, all p-values are displayed. (C) Top: cartoons representing the zebrafish full-length runx1a amino acid sequence and the dt-runx1 mutant deleted from the trans-activation domain and of the C-terminus note that the construct encodes for a C-terminal fusion with eGFP that is released upon expression via a cleavable T2A peptide (introduced between the 2xHA tag and the N-terminus of eGFP, to prevent from potential steric hindrance). nls, nuclear localization signal. Bottom: image of an anti-HA tag immunofluorescence obtained after z-projection of the dorsal aorta of a 50 hpf Tg(dt-runx1) embryo. Note the localization of the 2xHA-tagged dt-runx1 protein in nuclei (some of them are pointed by red arrowheads) and of eGFP in nuclei and the cytosol of aortic cells. Scale bar = 25 µm. Raw images (z-stacks) for this figure (dt-runx1 phenotype analysis) are available at https://doi.org/10.5281/zenodo.10932245. |