
Figure 7
- ID
- ZDB-FIG-240531-113
- Publication
- Torcq et al., 2024 - Tuning apicobasal polarity and junctional recycling in the hemogenic endothelium orchestrates the morphodynamic complexity of emerging pre-hematopoietic stem cells
- Other Figures
-
- Figure 1
- Figure 1—figure supplement 1.
- Figure 1—figure supplement 2.
- Figure 1—figure supplement 3.
- Figure 2
- Figure 2—figure supplement 1.
- Figure 2—figure supplement 2.
- Figure 3
- Figure 3—figure supplement 1.
- Figure 3—figure supplement 2.
- Figure 3—figure supplement 3.
- Figure 4
- Figure 4—figure supplement 1.
- Figure 4—figure supplement 2.
- Figure 4—figure supplement 3.
- Figure 4—figure supplement 4.
- Figure 5
- Figure 5—figure supplement 1.
- Figure 5—figure supplement 2.
- Figure 6
- Figure 6—figure supplement 1.
- Figure 7
- Figure 7—figure supplement 1.
- Figure 7—figure supplement 2.
- Figure 7—figure supplement 3.
- Figure 7—figure supplement 4.
- Figure 7—figure supplement 5.
- Figure 7—figure supplement 6.
- Figure 7—figure supplement 7.
- Figure 8.
- All Figure Page
- Back to All Figure Page
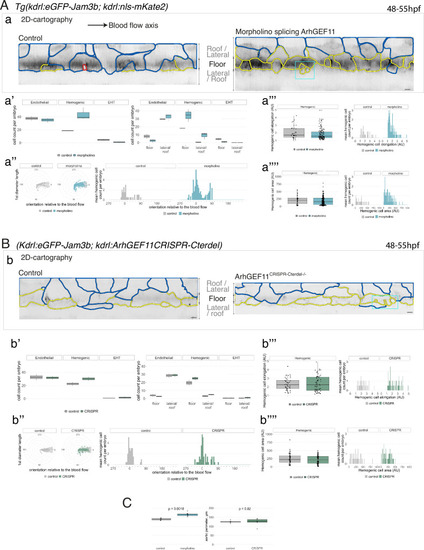
Interfering with ArhGEF11/PDZ-RhoGEF function leads to the accumulation of hemogenic cells and impairs EHT progression. (A-C) Numeration and morphometric analyses of aorta and cell types for Tg(kdrl:eGFP-Jam3b; kdrl:nls-mKate2) ArhGEF11 exon 38 splicing morpholino-injected and control embryos (A), or for (Kdrl:eGFP-Jam3b; kdrl:ArhGEF11CRISPR-Cterdel+/+) homozygous ArhGEF11 C-ter deletion mutants and control siblings. (B) Forty-eight to 55 hpf embryos were imaged using spinning disk confocal microscopy. (Aa, Bb) 2D-cartographies obtained after deploying aortic cylinders and showing the eGFP-Jam3b signals only with cell contours delineated either in blue (endothelial cells), yellow (hemogenic cells, see Materials and methods for their morphological definition), red (morphologically characterized EHT cells, for controls), and small cells delineated by cyan boxes (morphologically uncharacterized EHT cells and putative post-mitotic cells remaining as pairs, included in the numeration as hemogenic cells). Cellular contours have been semi-automatically segmented along the cellular interfaces labeled with eGFP-Jam3b (see Materials and methods). Scale bars: 10 µm. (Aa’, Bb’) Left: numeration of endothelial, hemogenic and EHT-undergoing cells according to the position of their geometrical center (either on the aortic floor, or on the roof, or on the lateral side), for each condition; right: number of endothelial, hemogenic and EHT-undergoing cells in each condition calculated from the segmentation of 3x2D-projections per embryo and covering the entire aortic regions in the trunk. (Aa’’, Bb’’) Left: length of hemogenic cells (in the longest axis) in function of their orientation (°) relative to the blood flow axis (0–180°); right: distribution of the orientation of hemogenic cells relative to the blood flow axis, displayed as a mean distribution of cells per embryo. (Aa’’’, Bb’’’) Hemogenic cell elongation factors in arbitrary Units (scale factor given by the ratio between the first- and the second-best fitting ellipse diameters, the minimum value being 1 for a non-elongated object) represented as boxplot distribution of all segmented cells (left) or as the distribution of cell elongation factor per embryo (right), for controls and for interfering conditions as indicated. (Aa’’’’, Bb’’’’) Hemogenic cell area represented as boxplot distribution of all segmented cells (left) or as the distribution of cell area per embryo (right), for controls and for interfering conditions as indicated. (C) Aaortic perimeter (in µm) for controls and mutant conditions as indicated. Statistical tests: two-sided unpaired two samples Wilcoxon test. For the ArhGEF11 exon 38 splicing morpholino condition, analysis was performed on 2 x control (non-injected embryos) and 3 x embryos injected at the one-cell stage; for the CRISPR mutant condition, analysis was performed on 2 x wild-type siblings for control and 2 x homozygous mutant embryos whose DNA mutation was confirmed by sequencing. Three consecutive aortic segments per embryo were analyzed to cover the whole length of the dorsal aorta, in the trunk region (covering a distance of 990 µm per embryo). Raw images (z-stacks and 2D cartographies) for panel (A) and Figure 7—figure supplement 5 (morphometric analysis of aortic cells in control and ArhGEF11 morpholino splicing conditions) are available at https://doi.org/10.5281/zenodo.10937430. Raw images (z-stacks and 2D cartographies) for panel (B) and Figure 7—figure supplement 6 (morphometric analysis of aortic cells in control and ArhGEF11 CRIPSR mutant conditions) are available at https://doi.org/10.5281/zenodo.10937434. |