
Figure 6
- ID
- ZDB-FIG-240531-111
- Publication
- Torcq et al., 2024 - Tuning apicobasal polarity and junctional recycling in the hemogenic endothelium orchestrates the morphodynamic complexity of emerging pre-hematopoietic stem cells
- Other Figures
-
- Figure 1
- Figure 1—figure supplement 1.
- Figure 1—figure supplement 2.
- Figure 1—figure supplement 3.
- Figure 2
- Figure 2—figure supplement 1.
- Figure 2—figure supplement 2.
- Figure 3
- Figure 3—figure supplement 1.
- Figure 3—figure supplement 2.
- Figure 3—figure supplement 3.
- Figure 4
- Figure 4—figure supplement 1.
- Figure 4—figure supplement 2.
- Figure 4—figure supplement 3.
- Figure 4—figure supplement 4.
- Figure 5
- Figure 5—figure supplement 1.
- Figure 5—figure supplement 2.
- Figure 6
- Figure 6—figure supplement 1.
- Figure 7
- Figure 7—figure supplement 1.
- Figure 7—figure supplement 2.
- Figure 7—figure supplement 3.
- Figure 7—figure supplement 4.
- Figure 7—figure supplement 5.
- Figure 7—figure supplement 6.
- Figure 7—figure supplement 7.
- Figure 8.
- All Figure Page
- Back to All Figure Page
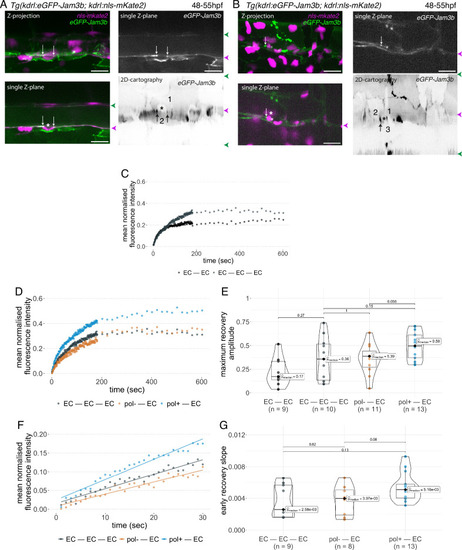
Junctional recycling at tri-cellular contacts is differentially controlled between the two EHT types. Forty-eight to 55 hpf Tg(kdrl:eGFP-Jam3b; kdrl:nls-mKate2) embryos were imaged using spinning disc confocal microscopy and illuminated for Fluorescence Recovery After Photobleaching (FRAP) in the trunk region (AGM, Aorta Gonad Mesonephros). (A, B) Panels are either maximum z-projections (top left) or single plane z-sections (bottom left and top right, focusing on the aortic floor) of aortic segments, with either the merged nls-mkate2 and eGFP-Jam3b fluorescence signals (magenta and green) or the eGFP-Jam3b signal only (black and white images). White arrows point at reinforcement of signal at antero-posterior junctional pools of an EHT pol+ cell (A) or of an EHT pol- cell (B), both marked by asterisks. Bottom right: 2D-cartographies obtained after deploying aortic cylinders and showing the eGFP-Jam3b signals only. Black arrows point at antero-posterior junctional pools, in particular at tri-junctional regions that exhibit increase in signal density (well visible in A black arrows). 2 and 3 endothelial cells are contacting the EHT pol+ cell (A) and the EHT pol- cell (B), respectively. In right margins, magenta and green arrowheads designate the aortic floor and roof, respectively. Scale bars = 20 µm. (C—G) FRAP analyses. EGFP-Jam3b junctional pools corresponding to the brightest spots inside junctional regions of interest were bleached for FRAP measurements (these high intensity pools were localized at the level of bi- and tri-junctions for endothelial cells (EC) and in tri-junctional regions for EHT pol+ and EHT pol- cells; all these junctional pools were systematically visualized by deploying each aortic segment before bleaching as shown in the 2D-cartographies in A and B as well as in Figure 6—figure supplement 1, see also Materials and methods). FRAP analysis concerned three types of junctional interfaces: between endothelial cells (EC – EC, black and grey), EHT pol- and endothelial cells (pol- – EC, brown), EHT pol+ and endothelial cells (pol+ – EC, blue). (C, D) Evolution of mean fluorescence intensity for each type of junctional interface over time (10 min), after photobleaching (t=0 s). (E) Median maximum amplitude of recovery of all determinations and for each type of junctional interface (maximum of simple exponential fitted curves). (F, G) Early fluorescence recovery. Early evolution (over the first 30 s) of the mean fluorescence intensity for each type of junctional interface over time after photobleaching (t=0 s). (F) The fitted lines correspond to linear regressions of mean fluorescence intensities. (G) Median values of fluorescence recovery slopes (linear regressions) of all determinations and for each type of junctional interface. (E, G) The number of biological replicate (n) is stated on the plots. Statistical tests: two-sided unpaired two samples Wilcoxon test. |