Image
Figure Caption

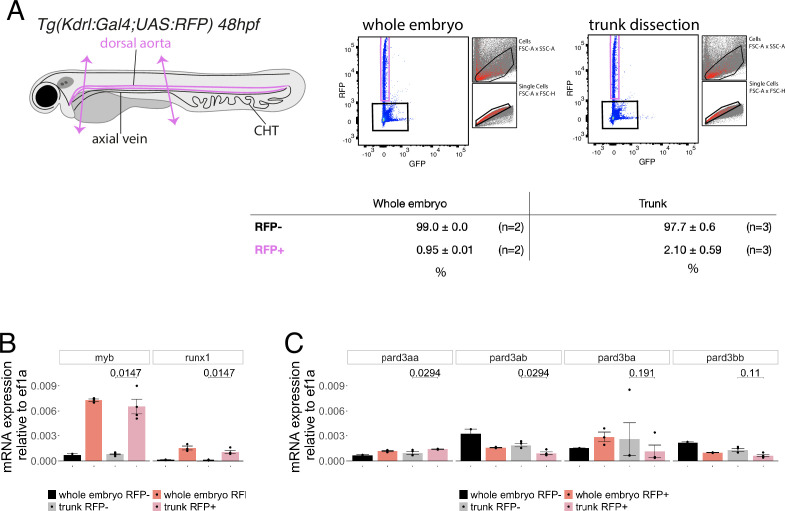
Figure 4—figure supplement 1. Expression levels of Pard3 mRNAs in FACS-sorted endothelial cells.

(A) Experimental strategy to isolate endothelial cells for subsequent gene expression analyses by qRT-PCR. 48hpf Tg(Kdrl:Gal4;UAS:RFP) whole embryos and trunk dissected regions (delimited by two magenta arrows) were treated to dissociate cells and populations of interest were sorted by FACS. n=2 experiments were performed for the whole embryo RFP+ cell population (left) and n=3 experiments were performed for the trunk RFP+ cell population (right). Subsequently, RNA was isolated from 20,000 negative cells (RFP-, black) and from 6500 to 9142 cells for the RFP expressing population (RFP+, magenta). The relative proportions of RFP+ and RFP- cells in the two conditions are displayed (table). (B, C) qRT-PCR analysis of gene expression levels of the hematopoietic markers myb and runx1 (B) and of the four Pard3 mRNAs (encoding for Pard3aa, ab, ba, and bb, (C)) in vascular and non-vascular cells from 48 to 50hpf whole embryos and dissected trunks. Graphs show the measured mean fold changes relative to ef1α. Statistical tests (two-sided unpaired two samples Wilcoxon test, all p-values are displayed) were only performed to compare expression levels in RFP + and RFP- cells isolated from trunk regions (three independent experiments).

Acknowledgments
This image is the copyrighted work of the attributed author or publisher, and ZFIN has permission only to display this image to its users. Additional permissions should be obtained from the applicable author or publisher of the image. Full text @ Elife