Image
Figure Caption

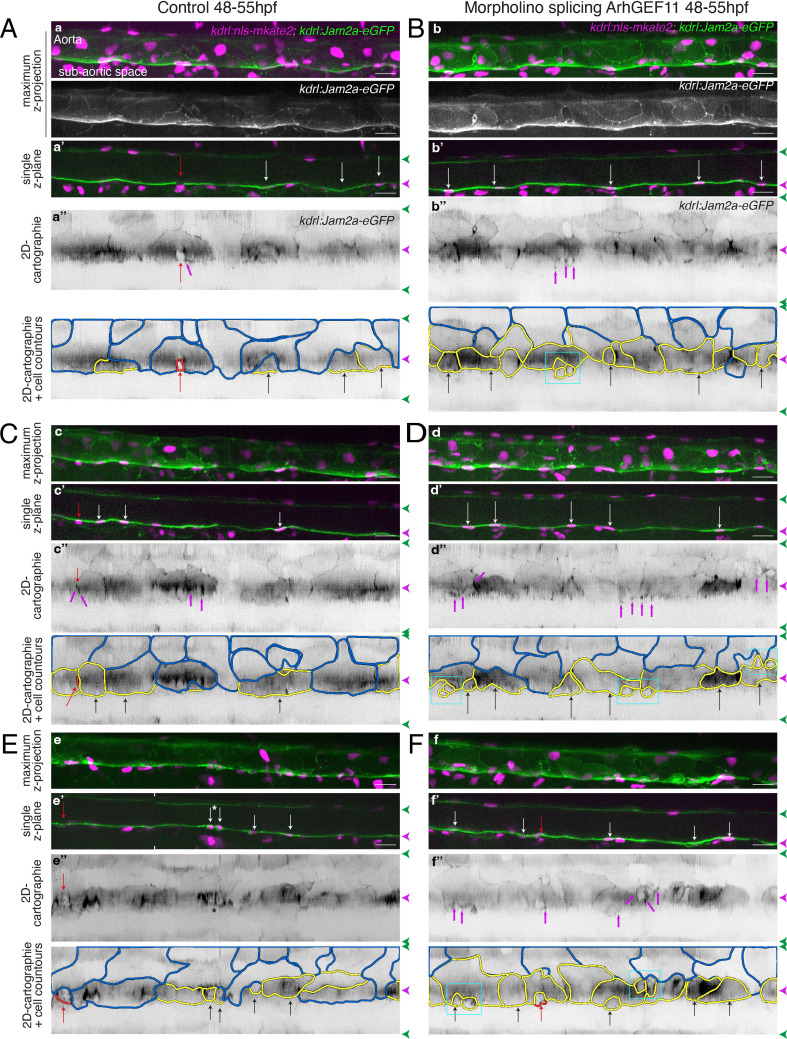
Figure 7—figure supplement 5. Supplementary data on the ArhGEF11/PDZ-RhoGEF exon 38 splicing morpholino phenotype.

Tg(kdrl:eGFP-Jam2a; kdrl:nls-mKate2) control (A, C, E) or MO-injected (B, D, F) embryos were imaged using spinning disk confocal microscopy (48–55 hpf time-window). Aorta segments (330 µm each) were imaged in the trunk region (AGM). The 2D-cartographies with delimited cellular contours in panels (A and B) are presented Figure 7A with the corresponding un-modified 2D-cartographies shown on top for unmasking of contours. Panels (A and C) illustrate two different segments from the same embryo. Panels (B, D, F) illustrate segments from three different embryos. (a–f) Maximum z-projections of merged nls-mkate2 and eGFP-Jam2a signals for control (a, c, e) and for ArhGEF11 exon 38 splicing morpholino (b, d, f) conditions. For panels (a) and (b), maximum z-projections of the eGFP-Jam2a signal only are also shown. (a’-f’) Single z-plane images of merged nls-mkate2 and eGFP-Jam2a signals for control (a’, c’, e’) and for ArhGEF11 exon 38 splicing morpholino (b’, d’, f’) conditions. For e’, the image is a composition of two different z-planes from the same field (the boundaries are marked with white ticks). In right margins, magenta and green arrowheads designate the aortic floor and roof, respectively. (a’’-f’’) 2D-cartographies (bottom, with delineated cellular contours) obtained from eGFP-Jam2a signals for control (a’’, c’’, e’’) and for the ArhGEF11 exon 38 splicing morpholino (b’’, d’’, f’’) conditions, respectively. Cell contours are delineated either in blue (endothelial cells), yellow (hemogenic cells), red (morphologically characterized EHT cells, red arrows), and small cells delineated by cyan boxes (morphologically uncharacterized EHT cells and putative post-mitotic cells remaining as pairs). Cellular contours have been semi-automatically segmented along the cellular interfaces labeled with eGFP-Jam3b (see Materials and methods). White and black arrows designate hemogenic cells with their nucleus visible on the z-section. Analyses were performed on 2 x control non-injected embryos and 3 x embryos injected at the one-cell stage with the ArhGEF11 exon 38 splicing MO. Scale bars = 20 µm.

Acknowledgments
This image is the copyrighted work of the attributed author or publisher, and ZFIN has permission only to display this image to its users. Additional permissions should be obtained from the applicable author or publisher of the image. Full text @ Elife