
|
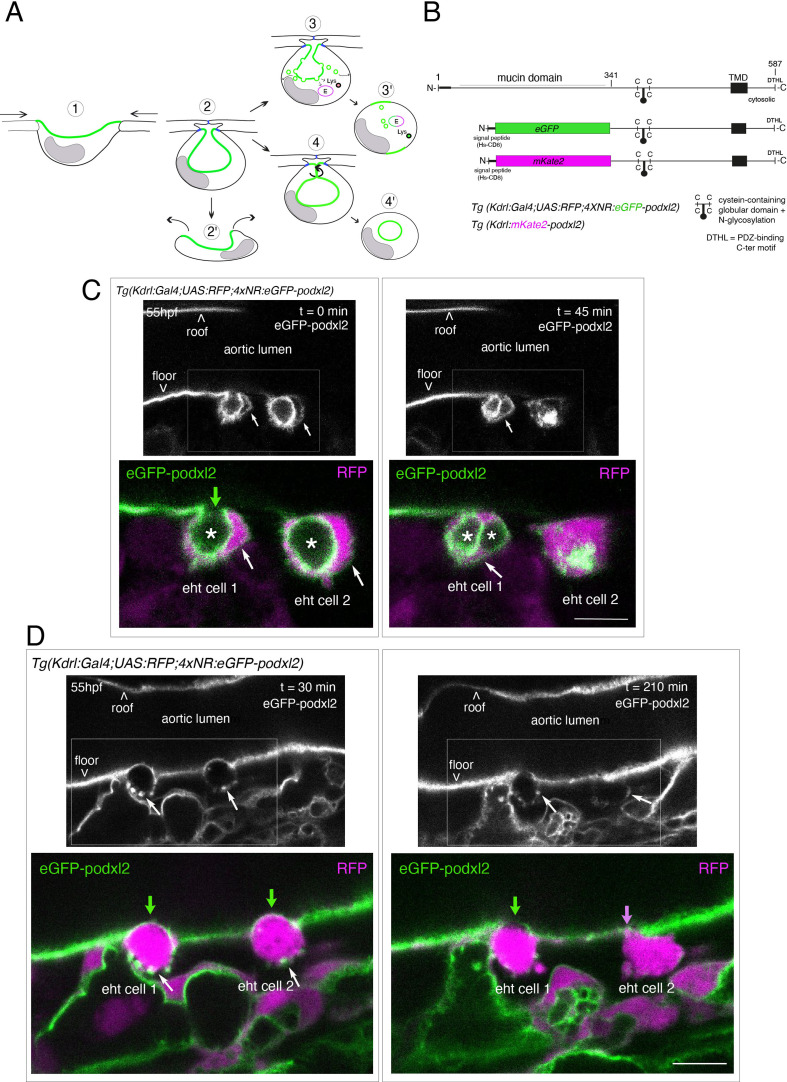
Figure 1 Tracing the evolution of the luminal membrane using the polarity marker Podocalyxin points at the biological significance of apicobasal polarity establishment in EHT cell emergence complexity. (A) Cartoons depicting the early and late steps of EHT cells emerging from the aortic floor (steps 1 and 2, as previously described in the zebrafish embryo, see Kissa and Herbomel, 2010; Lancino et al., 2018) and with hypothetical evolution of the luminal membrane (in green) before (3 and 4) and after the release 2’, the cell detaches from the endothelial layer via junction downregulation leading to exposure of the luminal membrane with le extracellular milieu; 3’, the luminal membrane is consumed via endocytic recycling (E) and/or lysosomal degradation (Lys) prior to detachment; 4’, the luminal membrane in 4 is released inside the cell (twisted arrow) before detachment. Grey area = nucleus. (B) PodocalyxinL2 (Podxl2) construct designed to establish transgenic fish lines. Cartoons representing full length (top drawing) and deleted Podxl2 (amino-acid sequence 341–587) in which the mucin domain (serine/threonine-rich O-glycosylation domain) is replaced by either eGFP or mKate2. The tetracystein-containing globular domain (subjected to N-glycosylation) was kept as favoring apical membrane retention. TMD, transmembrane domain; DTHL, (C)-terminal peptidic motif involved in partnership with PDZ domain containing proteins. (C, D) EHT performing cells visualized using Tg(Kdrl:Gal4;UAS:RFP;4xNR:eGFP-podxl2) embryos and time-lapse sequences initiated at 55 hpf obtained with spinning disk confocal microscopy (imaging was performed at the boundary between the most downstream region of the AGM and the beginning of the caudal hematopoietic tissue). Top grey panels show the green, eGFP channels for eGFP-podxl2 only. Bottom panels show the merge between green and red (soluble RFP, in magenta) channels. Scale bars = 8 µm. (C) Single plane images of 2 EHT pol+ cells extracted from a time-lapse sequence at t=0 and t=45 min, with the right cell (eht cell 2) more advanced in the emergence process than the left one (eht cell1). Note the enrichment of eGFP-podxl2 at the luminal membrane (surrounding the cavity labeled with an asterisk) in comparison to the basal membrane (white arrow). Note also the evolution of the luminal membranes with time, with the aortic and eht cell 1 lumens still connecting at t=0 (green arrow), the apparent fragmentation of the cytosolic vacuole (2 asterisks for eht cell 1 at t=45 min) and the compaction of Podxl2-containing membranes for eht cell 2 at t=45 min. More details on the evolution of the connection between the aortic/eht cell lumens are shown in Figure 1—figure supplement 1A. (D) Single plane images of 2 EHT pol- cells extracted from a time-lapse sequence at t=30 min and t=210 min (see Figure 1—video 3 for the full-time lapse sequence), with the right cell (eht cell 2) slightly more advanced in the emergence than the left one (eht cell 1, with the latest attachment point between the emerging cell and the aortic floor (pink arrow)). Note, in comparison with the cells in panel (C), the ovoid shapes of cells, the absence of enrichment of eGFP-podxl2 at luminal membranes (green arrows) and the accumulation of eGFP-podxl2 at basal membrane rounded protrusions (white arrows).