
Figure 4—figure supplement 2.
- ID
- ZDB-FIG-240531-102
- Publication
- Torcq et al., 2024 - Tuning apicobasal polarity and junctional recycling in the hemogenic endothelium orchestrates the morphodynamic complexity of emerging pre-hematopoietic stem cells
- Other Figures
-
- Figure 1
- Figure 1—figure supplement 1.
- Figure 1—figure supplement 2.
- Figure 1—figure supplement 3.
- Figure 2
- Figure 2—figure supplement 1.
- Figure 2—figure supplement 2.
- Figure 3
- Figure 3—figure supplement 1.
- Figure 3—figure supplement 2.
- Figure 3—figure supplement 3.
- Figure 4
- Figure 4—figure supplement 1.
- Figure 4—figure supplement 2.
- Figure 4—figure supplement 3.
- Figure 4—figure supplement 4.
- Figure 5
- Figure 5—figure supplement 1.
- Figure 5—figure supplement 2.
- Figure 6
- Figure 6—figure supplement 1.
- Figure 7
- Figure 7—figure supplement 1.
- Figure 7—figure supplement 2.
- Figure 7—figure supplement 3.
- Figure 7—figure supplement 4.
- Figure 7—figure supplement 5.
- Figure 7—figure supplement 6.
- Figure 7—figure supplement 7.
- Figure 8.
- All Figure Page
- Back to All Figure Page
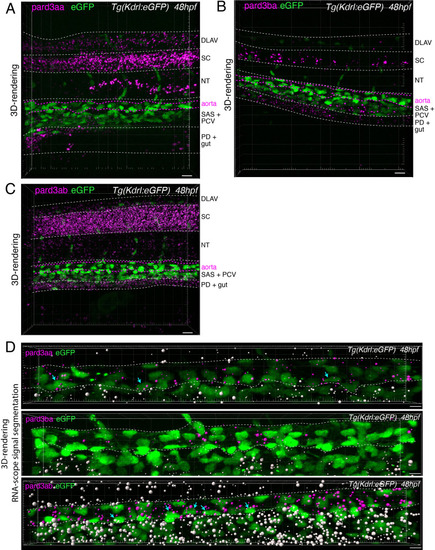
Localization of Pard3 mRNAs using RNAscope. ( |