
Figure 4
- ID
- ZDB-FIG-240531-100
- Publication
- Torcq et al., 2024 - Tuning apicobasal polarity and junctional recycling in the hemogenic endothelium orchestrates the morphodynamic complexity of emerging pre-hematopoietic stem cells
- Other Figures
-
- Figure 1
- Figure 1—figure supplement 1.
- Figure 1—figure supplement 2.
- Figure 1—figure supplement 3.
- Figure 2
- Figure 2—figure supplement 1.
- Figure 2—figure supplement 2.
- Figure 3
- Figure 3—figure supplement 1.
- Figure 3—figure supplement 2.
- Figure 3—figure supplement 3.
- Figure 4
- Figure 4—figure supplement 1.
- Figure 4—figure supplement 2.
- Figure 4—figure supplement 3.
- Figure 4—figure supplement 4.
- Figure 5
- Figure 5—figure supplement 1.
- Figure 5—figure supplement 2.
- Figure 6
- Figure 6—figure supplement 1.
- Figure 7
- Figure 7—figure supplement 1.
- Figure 7—figure supplement 2.
- Figure 7—figure supplement 3.
- Figure 7—figure supplement 4.
- Figure 7—figure supplement 5.
- Figure 7—figure supplement 6.
- Figure 7—figure supplement 7.
- Figure 8.
- All Figure Page
- Back to All Figure Page
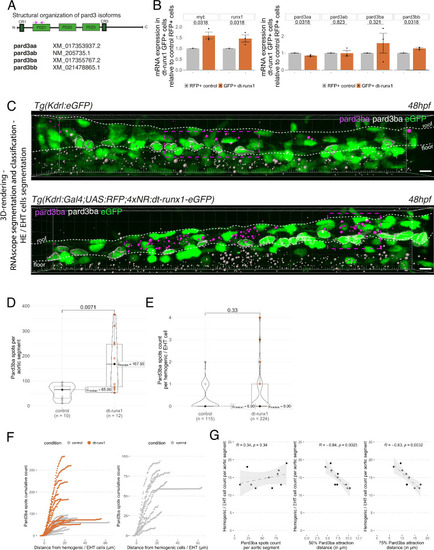
Pard3ba expression is highly sensitive to interference with Runx1 activity. (A) Pard3aa, ab, ba, and bb zebrafish gene products, with their accession numbers. The cartoon represents the common structures of the four proteins, with the three sequential PDZ domains (PDZ1-3), and the CR1 and CR3 conserved regions involved in oligomerization and atypical protein kinase C (aPKC) binding, respectively. The magenta arrows show the positioning of qRT-PCR primers, located in the PDZ1 domain (see Materials and ethods for primer sequences). (B) qRT-PCR analysis of genes expression levels of (left) the hematopoietic markers myb and runx1, (right) the four Pard3 mRNAs (encoding for Pard3aa, ab, ba, and bb) in cell populations isolated from FACS-sorted trunk vascular cells of 48–50 hpf control and mutant embryos (see Figure 4—figure supplement 1, Figure 4—figure supplement 2 and Materials and methods for cell isolation procedures). Graphs show the measured mean fold changes relative to the expression of ef1α and to the expression in RFP+ control cells. Statistical tests: two-sided unpaired two samples Wilcoxon test, all p-values are displayed. Analysis was carried out on n=3 for control and mutant conditions. (C) Representatives images (Imaris 3D-rendering) of RNAscope in situ hybridizations for Pard3ba in 48–50hpf Tg(Kdrl:eGFP) control embryos and Tg(Kdrl:Gal4;UAS:RFP;4xNR:dt-runx1-eGFP) mutant embryos. The aorta is outlined with the white dashed lines. The RNAscope signal was segmented into spots and classified based on its localization: in aortic endothelial and hemogenic cells (magenta spots) or in extra-aortic tissues (grey spots, essentially residing in the sub-aortic space). Magenta dashed boxes delineate examples of mRNA Enriched Regions (MERs) in control and mutant embryos. Scale bars = 10 µm. (D) Pard3ba spots count per aortic segment. (E) Pard3ba spots count per hemogenic/EHT cells. (F) Cumulative Pard3ba spots count relative to hemogenic/EHT cell distance, averaged for each aortic segment, in control embryos (grey) and dt-runx1 mutant embryos (orange). (G) HE/EHT cell count relative to number of spots, all expressed per aortic segment (left), 50% Pard3ba spots attraction distance (in µm) (middle) or 75% Pard3ba spots attraction distance (in µm) (right). 50%/75% spots attraction distance corresponds to the distance from hemogenic/EHT cells within which 50%/75% of Pard3ba spots are located. Grey dash lines correspond to regression lines and light grey background correspond to the confidence interval (95%) of the regression model. Linear correlation coefficient (R, Pearson correlation) is displayed for each condition. For (D and E), statistical tests: two-sided unpaired two samples Wilcoxon test, all p-values are displayed. Analysis was carried out on n=5 control embryos and n=6 mutant embryos, 2 aortic segments per embryos. For (G) p-values were calculated using a t-test. Raw images (z-stacks) for this figure and Figure 4—figure supplement 3 (Pard3 mRNA expression in control and mutant conditions) are available at https://doi.org/10.5281/zenodo.10937428. |