Image
Figure Caption

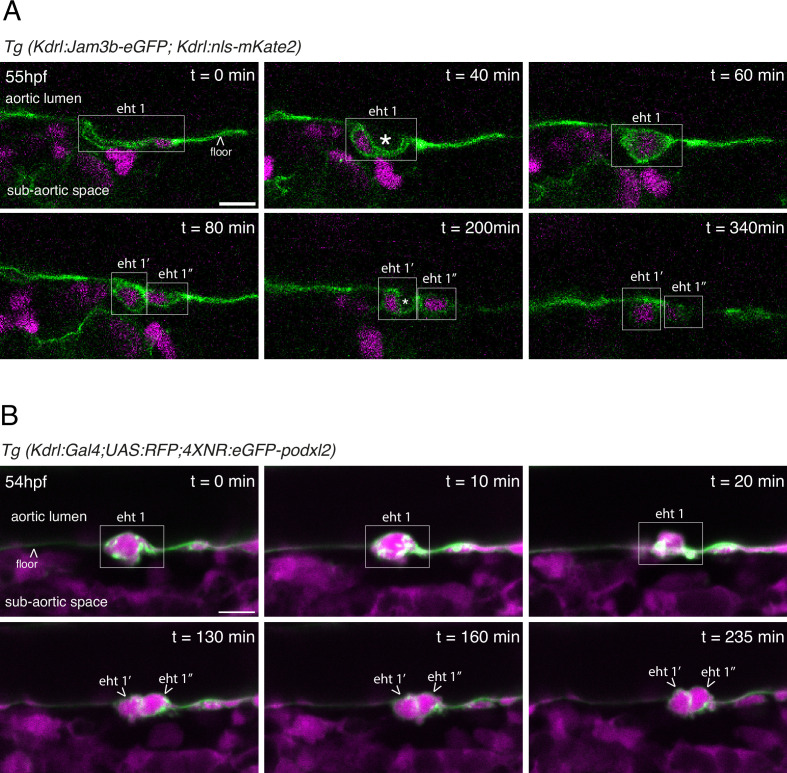
Figure 1—figure supplement 2. EHT pol+ and EHT pol- cells recover their respective morphology after mitosis.

(A) EHT pol+ cell extrusion and division visualized using a Tg(Kdrl:Jam3b-eGFP;Kdrl:nls-mKate2) embryo and time-lapse sequence (initiated at 55 hpf) obtained using laser scanning confocal microscopy (single z-planes). This transgenic line allows the visualization of nuclei (nls-mKate2, magenta) and intercellular contacts as well as plasma membranes (eGFP-Jam3b, see Materials and methods and Figure 5 for more information). The eht 1 cell (white box) starts invaginating before t=0 min, and displays the characteristic luminal membrane invagination of EHT pol+ cells at t=40 min. At t=60 min, the cell undergoes mitosis. At t=80 min, the two daughter cells (eht 1’ and eht 1’’) are still contacting each other. At this point, they still have the slightly rounded morphology of post-mitotic cells. At t=200 min, the eht 1’ cell has resumed its extrusion and its luminal membrane is invaginated. By t=340 min, the extrusion of the eht 1’ cell is complete, and the cell remains in contact with the aortic floor. The eht 1’’ cell resumes its extrusion later, also displaying an invagination of its luminal membrane (but not visible on the same plane as for the eht 1’ cell). White asterisks label the lumen delimited by the luminal/apical membranes. (B) EHT pol- cell extrusion and division visualized using a Tg(Kdrl:Gal4;UAS:RFP;4XNR:eGFP-podxl2) embryo and time-lapse sequence (initiated at 54 hpf) obtained with spinning disk confocal microscopy (single z-planes), at the bottom of the trunk region. The eht 1 cell (white box) is undergoing extrusion at t=0 min, and displays the characteristic rounded/ovoid shape of EHT pol- cells at t=0 min and t=10 min. At t=20 min, the cell starts undergoing mitosis. At t=130 min, we can observe the two daughter cells (eht 1’ and eht 1’’) still contacting each other. From t=130 min to t=235 min, the two daughter cells slowly continue their extrusion, keep contacting each other, and increase their roundness, with partitioning of eGFP-podxl2 between the luminal and basal membranes. All throughout the time-lapse sequence, the eht 1 cell and, subsequently, the eht 1’ and eht 1’’ cells do not display any enrichment of eGFP-podxl2 at their luminal membranes. Scale bars = 10 µm.

Acknowledgments
This image is the copyrighted work of the attributed author or publisher, and ZFIN has permission only to display this image to its users. Additional permissions should be obtained from the applicable author or publisher of the image. Full text @ Elife