
|
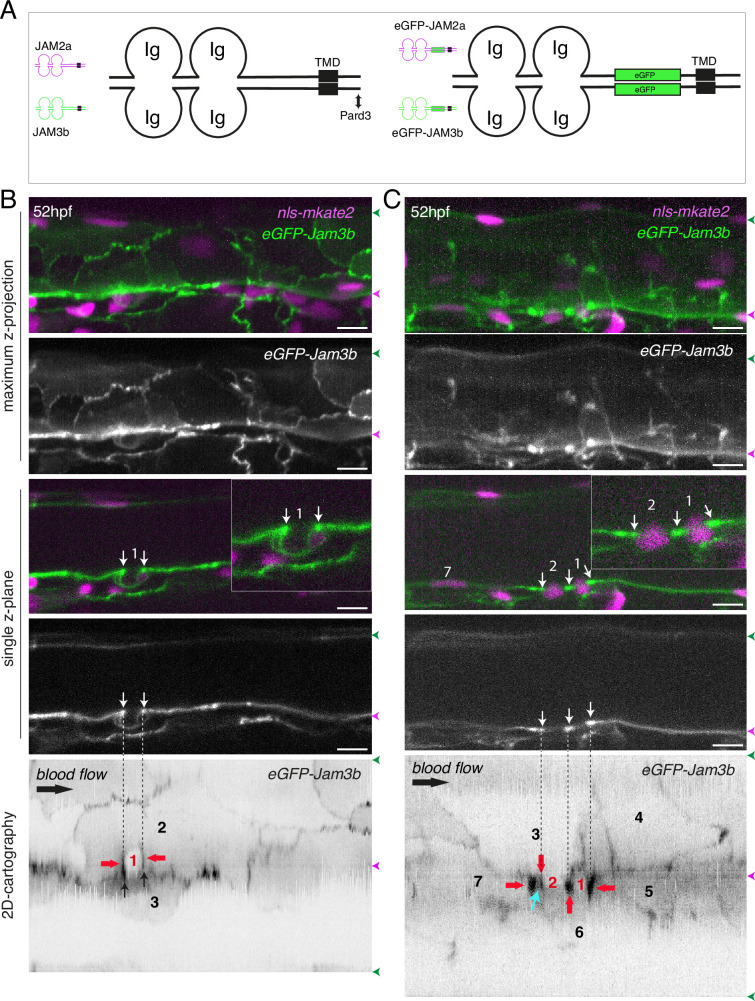
Figure 5 eGFP-Jam3b localization is reinforced at antero-posterior sites of the endothelial/EHT interface and at tri-cellular junctions. (A) Cartoons representing homodimers of full-length JAMs with the C-terminal cytosolic part interacting with Pard3 (JAMs interact with the first PDZ domain of Pard3) as well as the constructs generated in this study and containing eGFP inserted between the Immunoglobulin-like (Ig) domains and the trans-membrane region (TMD). The constructs were obtained for zebrafish JAM2a and JAM3b. (B, C) 52 hpf Tg(kdrl:eGFP-Jam3b; kdrl:nls-mKate2) embryos were imaged in the trunk region (AGM) using spinning disc confocal microscopy. The panels are either maximum z-projections (top two) or single plane z-sections (bottom two, focusing on the aortic floor) of aortic segments, with either the merged nls-mkate2 and eGFP-Jam3b fluorescence signals (magenta and green) or the eGFP-Jam3b signal only (black and white images). Bottom of the figure: 2D-cartographies obtained after deploying aortic cylinders and showing the eGFP-Jam3b signals only. The white/black vertical dashed lines show the correspondence of the antero-posterior junctional reinforcements in the single z-sections (white arrows) on the respective 2D-cartographies resulting from the deployment of the aortic walls (obtained from the z-stacks). (B) Example of an EHT pol+ cell (cell 1, white arrows point at reinforcement of signal at antero-posterior junctions). On the 2D cartography, cell 1 (red) is contacting endothelial cells 2 and 3; note the reinforcement of eGFP-Jam3b signals along antero-posterior membrane interfaces perpendicular to blood flow (red arrows) as well as at the two tri-cellular junctions visible between cells 1, 2 and 3 (black arrows). (C) Example of two EHT pol- cells (cells 1 and 2, white arrows point at reinforcement of signal at antero-posterior junctions). On the 2D cartography, cells 1 and 2 (red) are contacting endothelial cells 3, 4, 6 and 3, 6 respectively; note the reinforcement of eGFP-Jam3b signals along antero-posterior membrane interfaces perpendicular to blood flow (red arrows) and endothelial cell 6 that has intercalated between endothelial cell 7 and EHT pol- cell 2 (blue arrow). In right margins, magenta and green arrowheads designate the aortic floor and roof, respectively. Scale bars = 10 µm.