
- Title
-
hand2 and Dlx genes specify dorsal, intermediate and ventral domains within zebrafish pharyngeal arches
- Authors
- Talbot, J.C., Johnson, S.L., and Kimmel, C.B.
- Source
- Full text @ Development
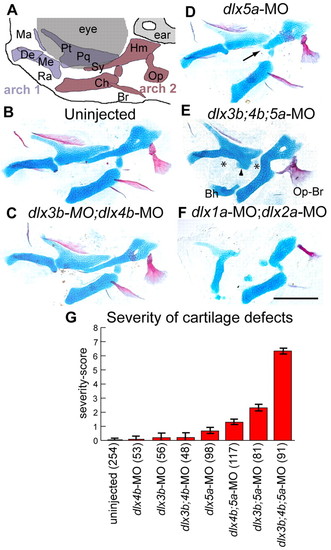
Dlx function is required in intermediate domain skeleton. (A) Schematic of facial skeleton. Anterior is towards the left, dorsal is upwards. (B-F) Alcian Blue (cartilage) and Alizarin Red (bone) stained pharyngeal skeletons with Dlx morpholino treatments at 6 dpf. (B) Uninjected, (C) dlx3b-MO;dlx4b-MO and (D) dlx5a-MO fish look very similar, although dlx5a-MO sometimes causes shortened symplectic cartilages (arrow). (E) Injection of dlx3b;4b;5a-MO frequently causes dramatic skeletal defects, including joint loss (asterisks), fusion of OP and BSR bones (Op-Br), and ectopic processes attached to the palatoquadrate (arrowhead), or ventrally in the face. (F) By contrast, dlx1a-MO;dlx2a-MO injection causes defects in both dorsal and intermediate cartilages. (G) Plot of severity scores, showing that dlx3b-MO, dlx4b-MO and dlx5a-MO interact to create more than additive changes in intermediate domain skeletal phenotypes. Error bars are 95% confidence intervals, determined by ANOVA. Fish were scored bilaterally for prominent cartilage defects: first arch joint fusions, second arch joint fusions, symplectic defects, palatoquadrate defects and ectopic cartilages. Although each phenotype was seen at a range of expressivity, we assigned any defect a score of `1′, irrespective of expressivity. The `severity-score′ is the sum of these defects for both sides of the fish. Skeletal elements indicated in A are the first arch-derived Meckel′s cartilage (Me), including its retroarticular process (Ra), palatoquadrate (Pq) cartilage and its pterygoid process (Pt), as well as maxillary (Ma) and dentary (De) bones. The second arch gives rise to the ceratohyal cartilage (Ch), the hyosymplectic cartilage, which comprise distinctive hyomandibular (Hm) and symplectic (Sy) regions, as well as opercle (Op) and branchiostegal (Br) bones. A remnant of the basihyal cartilage (Bh) remains attached to the Ch in (E), as a mounting artifact. Scale bar: 100 μm. PHENOTYPE:
|

Early patterning domains are revealed by Dlx gene, hand2 and edn1 expression. (A-O) Single confocal sections of fluorescent RNA in situ hybridization, anterior towards the left, dorsal upwards. The images in A-E are single channels from the confocal images in F-J. Outlines (K-O) of individual expression channels from F-J illustrate relative gene expression boundaries. (M) Arrowheads indicate dlx3b expression in the (left) stomodeum and (right) second endodermal pouch. Scale bar: 50 μm. |
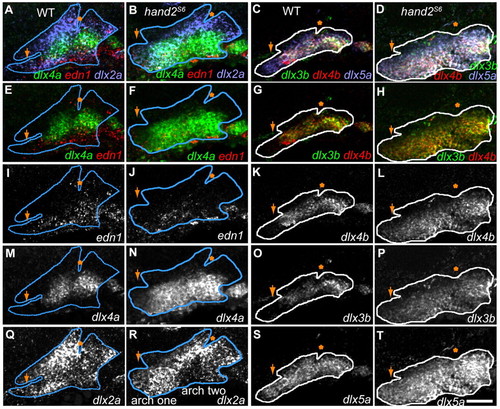
Dlx expression expands ventrally in hand2 mutants. Images are projections from confocal stacks of 36 hpf RNA in situ, with anterior leftwards, dorsal upwards. For context, dlx2a (blue lines) or dlx5a expression (white lines) is outlined in the first two arches. (A) In wild-type fish, dlx4b is expressed dorsal to the edn1-expressing mesoderm and ectoderm. However, in hand2S6 fish (B), dlx4a is expressed both within the ventral edn1 expressing region and in the intermediate mesenchyme. Although expanded, dlx4a expression remains ventral to the. Similarly, compared with wild type (C), dlx3b and dlx4b expression expands into ventral regions of hand2S6 (D), while remaining ventral to stomodeum and first pouch. (E-T) Separated confocal channels from A-D. Scale bar: 50 μm. Arrows indicate stomodeum; asterisks indicate the first pouch. EXPRESSION / LABELING:
|

hand2 and dlx3b/4b/5a have opposing roles in regulating gsc and nkx3.2. (A-T) Lateral views (left; anterior leftwards, dorsal upwards) taken from single confocal sections of RNA in situs and reconstructed orthogonal sections (right; medial leftwards, dorsal upwards) through the first arch joint region of 48 hpf fish. Markers are indicated on the left panel of each row, and treatments are indicated above each column. nkx3.2 expression is often reduced by (J) dlx3b;4b;5a-MO injection (80% penetrance), expanded in (K) uninjected hand2S6, but reduced in (L) hand2S6;dlx3b;4b;5a-MO. (N) In wild-type fish injected with dlx3b;4b;5a-MO, the dorsal and ventral gsc domains are occasionally (7% penetrance) found fused together (asterisk), medial to (F) nkx3.2 expression. (O) In uninjected hand2S6 fish, ventral first arch gsc is lost, but some dorsal expression remains (arrowhead). (P) In hand2S6;dlx3b;4b;5a-MO, ventral gsc is defective in arch one, and sometimes reduced (45% penetrance) in arch two, whereas ectopic gsc is seen attached to dorsal arch one expression (55% penetrance, arrow), medial to nkx3.2. Scale bar: 100 μm. EXPRESSION / LABELING:
|
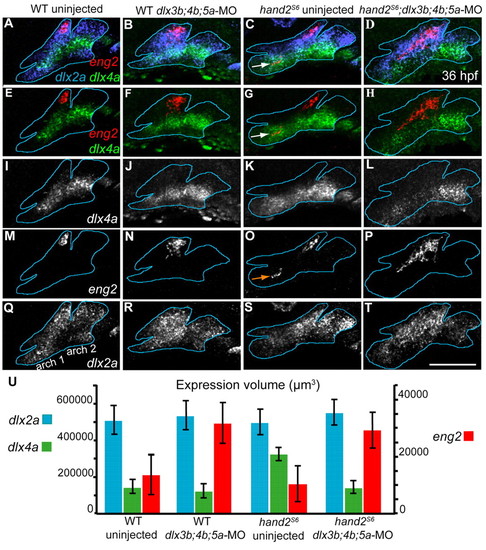
hand2 and dlx3b/4b/5a repress dorsal identity. (A-T) Projections of confocal stacks of 36 hpf RNA in situs. Arch one and two are outlined in blue, using dlx2a expression as a guide. Markers are indicated on the left panel of each row, and treatments indicated above each column. Anterior is leftwards, dorsal upwards. (O) In hand2S6, ectopic eng2 is indicated with an arrow. (U) Volumes (y-axis) of dlx2a, dlx4a and eng2 expression. Error bars are 95% confidence intervals, from ANOVA. Measurements were made on confocal stacks of randomly selected fish, using the `find objects by intensity′ function in Volocity software. Intensity thresholds were adjusted from fish to fish, in order to accurately identify expression. There are no significant differences between fish classes in average intensity levels. Each bar shows the combined volumes of arches one to three, because these arches were sometimes identified as one object by the software. Scale bar: 100 μm. EXPRESSION / LABELING:
|

The patterning domains delineated by Dlx genes and hand2 can be connected to specific pre-skeletal shapes at 60 hpf. (A-P) Lateral views (anterior to the left, dorsal upwards) of RNA in situs confocal sections illustrate differences in dorsal expression boundaries, whereas ventral views (Q-T) (anterior towards the left, lateral upwards) illustrate ventral boundaries. (A-P) Merge of indicated markers is shown in the left column, whereas the other columns show single channels taken from the merge. Joints in the first two arches are indicated by asterisks. Confocal sections in I-L are lateral to cartilages, making the locations of underlying joints difficult to determine. Outlines in single channel panels follow the color schemes shown in the left column. CH, ceratohyal cartilage; HM, hyomandibular region; M, Meckel′s cartilage; PQ, palatoquadrate cartilage; RA, retroarticular process; SY, symplectic region. Scale bar: 50 μm. |
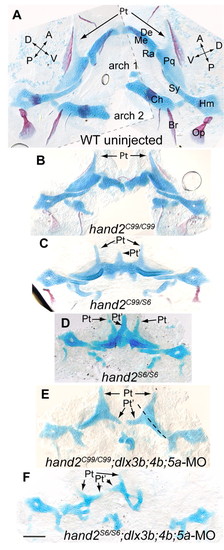
hand2 mutants and hand2 mutants injected with dlx3b;4b;5a-MO show homeotic skeletal phenotypes. (A-F) Alcian Blue and Alizarin Red staining at 6 dpf. Images are flat mounted bilateral pharyngeal arches, oriented with midline to the center, and anterior upwards. (A) The wild-type skeleton was too large for a single image at this magnification, so two images were overlaid for this panel (border indicated with a broken grey line). (B) hand2C99 homozygotes have reduced ventral, but normal intermediate and dorsal domain skeleton. (C) In trans-heterozygous fish carrying hand2C99 and hand2S6, defects are typically more severe than in hand2C99 homozygotes, but less severe than in (D) hand2S6 homozygotes. In hand2S6 homozygotes, broad cartilages often span the midline, similar in shape to duplicated palatoquadrates, complete with pterygoid processes (arrows). (E) When hand2C99 homozygotes are injected with dlx3b;4b;5a-MO, joints are lost in both arches, and the remainder of Meckel′s cartilage is tapered out into a shape similar to a pterygoid process. A broken line indicates the first arch dorsal-ventral plane of symmetry. (F) The cartilage expansions of hand2S6 are lost when dlx3b;4b;5a-MO is injected. The palatoquadrate of hand2S6;dlx3b;4b;5a-MO is often severely defective, though the distance between the first and second arch-derived skeleton seen on the left side of F is exaggerated by mounting artifacts. Scale bar: 100 μm. PHENOTYPE:
|
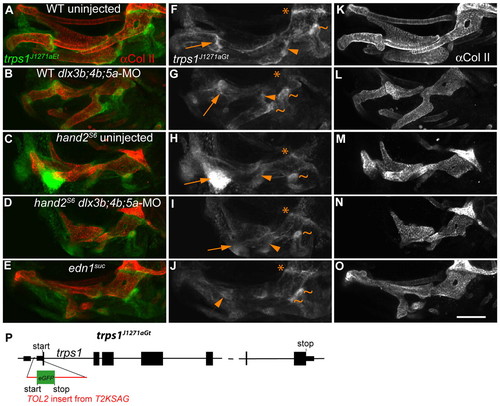
Jaw joint expression of trps1J1271aGt is regulated by Edn1 signaling, and the Edn1 targets hand2 and dlx3b/4b/5a. (A-O) Confocal projections of 4 dpf anti-Collagen II and trps1J1271aGt labeling is shown, merged in the left panel, and split in the center and right panels. Treatments are indicated in the left column. Anterior is leftwards, dorsal upwards. (A) In wild type, trps1J1271aGt expression is faint in skeleton, and very bright in joints. (B) dlx3b;4b;5a-MO injection reduces trps1j1271aGt in the first, (arrow) and second (arrowhead) arch joints, whereas the fused OP-BSR (tildes) bone expresses ectopic trps1j1271aGt. (C) In hand2S6, the jaw joint expression of trps1J1271aGt expands dramatically, beneath broad ectopic cartilages. (D) In hand2S6;dlx3b;4b;5a-MO, the expanded cartilages and trps1J1271aGt expression domains in the first arch are reduced compared to uninjected hand2S6. (E) In edn1 mutants, the first and second arch joint expression of trps1J1271aGt is lost, and conversely the opercle-hyomandibular joint expands. Throughout these treatments, the hyomandibular-neurocranium joint (asterisk) is normal. (P) Diagram of the J1271a insertion site in trps1 ( GenBank Accession Number, GU556967) . Intronic sequence is not to scale. We identified the 5′ end ( GenBank Accession Number, GU474515) of the trps1 gene by 5′ RACE from a predicted, incomplete trps1 sequence, ENSDART0000098144. trps1 5′ RACE revealed a single 5′ noncoding exon, with the J1271a integration site in the first intron. The splice acceptor orientation in T2KSAG predicts that it should be spliced into the processed message, with translation beginning at the initiating methionine in GFP, probably making J1271a a gene trap. Scale bar: 100 μm. EXPRESSION / LABELING:
|
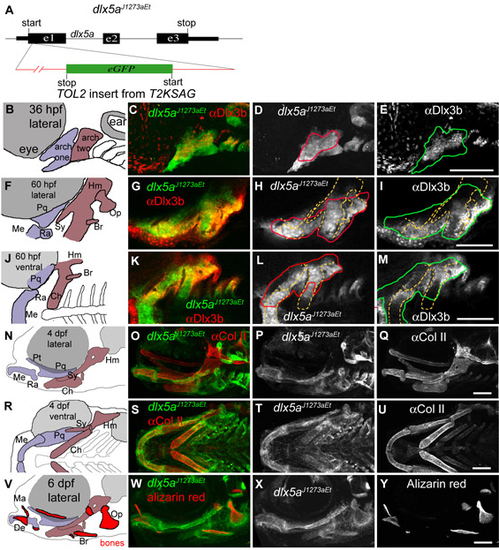
Anti-Dlx3b and dlx5a1073aEt support dlx3b and dlx5a gene expression patterns. (A) A diagram of dlx5aj1073aEt. Transposon T2SKAG is inserted in the first exon of dlx5a, with GFP-coding sequence in opposite orientation from dlx5a. Thus, although this insertion generates a loss-of-function allele of dlx5a, it is not likely to produce a dlx5a:GFP fusion protein. Instead, 5′ RACE shows that GFP-containing transcripts initiate from a cryptic promoter site within the transposon sequence, suggesting that this weak promoter may allow the T2KSAG transposon to act as an enhancer trap, in this case revealing the activity of the enhancers driving dlx5a expression. (B-Y) Panels in the far left column are schematics of the views shown in confocal images. Skeletal abbreviations are as described in Fig. 1. Panels in the second-from-left column are merges of the single channel expression seen to the right. (C-E) Confocal projections at 36 hpf show that dlx5aJ1073aEt is expressed more broadly than Dlx3b immunolabeling. (G-I) Lateral (anterior leftwards, dorsal upwards) and (K-M) ventral (anterior leftwards, lateral upwards) confocal sections reveal that at 60 hpf dlx5aJ1073aEt still shows expression broader than Dlx3b immunolabel. Inferred skeletal element locations are indicated with broken yellow lines in single channel images. Gene expression outlines follow the color scheme shown in merged confocal images. (N-U) Projections of confocal stacks of ∼Col II/∼GFP label confirm dlx5aJ1073a expression within cartilage cells. (V-Y) Projections of confocal stacks showing GFP and Alizarin Red label at 6 dpf confirm dlx5aJ1073a expression within bones. All fish shown are heterozygous for dlx5aJ1073aEt. Scale bars: 100 μm. |
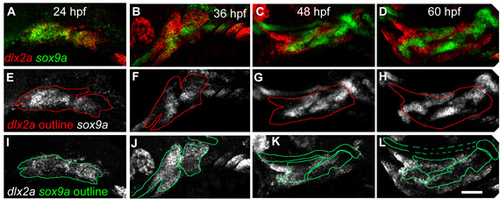
A timecourse of sox9a and dlx2a expression. (A-D) Projected confocal stacks showing sox9a and dlx2a expression at (A) 24 hpf, (B) 36 hpf, (C) 48 hpf and (D) 60 hpf. Anterior is towards the left, dorsal upwards. (A) At 24 hpf, dlx2a and sox9a are co-expressed throughout most of crest-derived pharyngeal arch regions. By 36 hpf (B) sox9a expression resembles rudimentary cartilaginous skeleton, including the presumptive neurocranium, dorsal to dlx2a. By 48 hpf (C), dlx2a expression is reduced in sox9a-expressing cells, which increasingly resembles cartilaginous skeleton. By 60 hpf, (D) dlx2a and sox9a show little co-expression outside the intermediate domain. (E-L) The same images as A-D, but with (E-H) sox9a expression shown, and dlx2a outlined, or with (I-L) dlx2a expression shown, and sox9a outlined. Scale bar: 50 μm. |
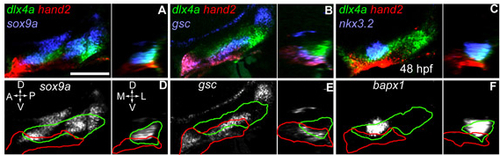
nkx3.2 is expressed within the intermediate domain, whereas gsc is expressed within dorsal and ventral domains. For each panel, we show (right) comparable lateral confocal sections (anterior towards the left, dorsal upwards), and (left) reconstructed orthogonal sections (medial towards the left, dorsal upwards) taken through the presumptive jaw joint region. (A-C) Triple RNA in situ of hand2 and dlx4a with (A) sox9a, (B) gsc and (C) nkx3.2 at 48 hpf. (D-F) hand2 and dlx4a outlined over (D) sox9a, (E) gsc and (F) nkx3.2 channels taken from A-C. Scale bar: 100 μm. |
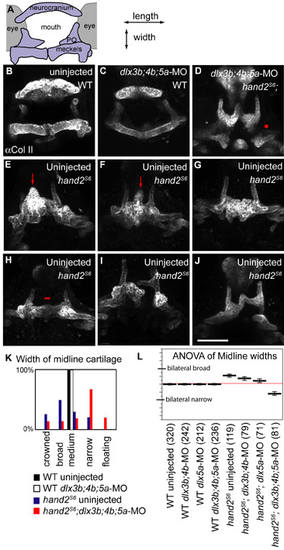
The shapes of first arch-derived skeleton are highly variable in hand2S6, but show significant changes after dlxb3;4b;5a-MO injection. (A) Schematic of anterior view, medial towards the center, dorsal upwards. (B-J) Anterior views of fish immunolabeled for Collagen IIa1. E is the same fish as is shown in Fig. 8C, for comparison of lateral view with anterior view. Images are projections of confocal stacks. (B) Uninjected and (C) dlx3b;4b;5a-MO injected wild-type fish have similar ventral shapes. (D) hand2S6 homozygotes injected with dlx3b;4b;5a-MO typically have narrowed midline cartilages (narrow), which may be separated from posterior PQ (asterisk: floating). (E-J) A phenotypic series of midline cartilage shapes in uninjected hand2S6. (E,F) The ventral midline sometimes contains a cartilaginous peak (arrow: crowned). (G) In other fish, the palatoquadrate expands (broad), but without ectopic pterygoids. (H) The ventral cartilages are sometimes similar to wild type in width (tilde: medium), though they are shortened in length. (I) Cartilages are not always bilaterally symmetrical. (I,J) Rarely, narrow cartilages are also seen in uninjected hand2S6; (K) however, a histogram of fish in each shape class shows that uninjected hand2S6 homozygotes typically look dramatically different from hand2S6 homozygotes injected with dlx3b;4b;5a-MO. (L) The shape classes were converted into a numeric score of midline size, and the means of these scores are plotted as thick black lines. Global mean is indicated with a thin red line. Error bars are 95% confidence intervals, determined by ANOVA. Number of fish scored is given in parentheses. Scale bar: 100 μm. |