
Fig. S2
- ID
- ZDB-IMAGE-100806-108
- Publication
- Talbot et al., 2010 - hand2 and Dlx genes specify dorsal, intermediate and ventral domains within zebrafish pharyngeal arches
- All Figures
- Figures for Talbot et al., 2010
|
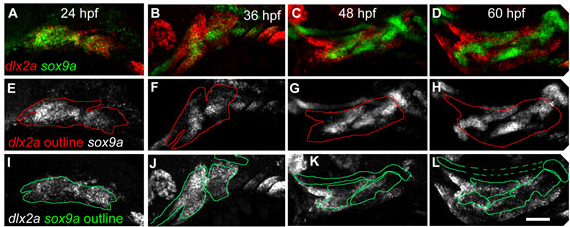
Fig. S2 A timecourse of sox9a and dlx2a expression. (A-D) Projected confocal stacks showing sox9a and dlx2a expression at (A) 24 hpf, (B) 36 hpf, (C) 48 hpf and (D) 60 hpf. Anterior is towards the left, dorsal upwards. (A) At 24 hpf, dlx2a and sox9a are co-expressed throughout most of crest-derived pharyngeal arch regions. By 36 hpf (B) sox9a expression resembles rudimentary cartilaginous skeleton, including the presumptive neurocranium, dorsal to dlx2a. By 48 hpf (C), dlx2a expression is reduced in sox9a-expressing cells, which increasingly resembles cartilaginous skeleton. By 60 hpf, (D) dlx2a and sox9a show little co-expression outside the intermediate domain. (E-L) The same images as A-D, but with (E-H) sox9a expression shown, and dlx2a outlined, or with (I-L) dlx2a expression shown, and sox9a outlined. Scale bar: 50 μm.