- Title
-
Loss of ribosomal protein L11 affects zebrafish embryonic development through a p53-dependent apoptotic response
- Authors
- Chakraborty, A., Uechi, T., Higa, S., Torihara, H., and Kenmochi, N.
- Source
- Full text @ PLoS One
|
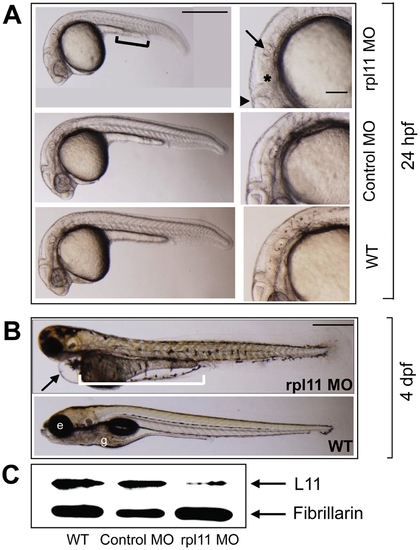
L11 deficiency causes morphological defects in zebrafish. (A) Lateral views of morphants (rpl11 MO, upper panel), controls (control MO, middle panel), and wild-type embryos (WT, lower panel) at 24 hpf. The morphants are smaller in size to the control embryos and the yolk sac extension is incomplete (black solid line). The right hand panel shows a close-up of the head region. The morphants display deformities in various parts of the brain, such as the midbrain-hindbrain boundary (filled black triangle), hindbrain (asterisk), and otolith (arrow). (B) Morphological observation of morphants and wild-type embryos at 4 dpf. The morphants have a smaller head and eyes, severe edema of the heart (arrow, upper panel), and incomplete yolk consumption with no gut (white solid line, upper panel) compared to wild-type embryos. (C) Western blot analysis of L11 in the morphants and control embryos with fibrillarin as a loading control. All images are anterior to the left. Scale bars: A, 500 μm (left panel), 100 μm (right panel); B, 500 μm. e, eye; g, gut. |
|
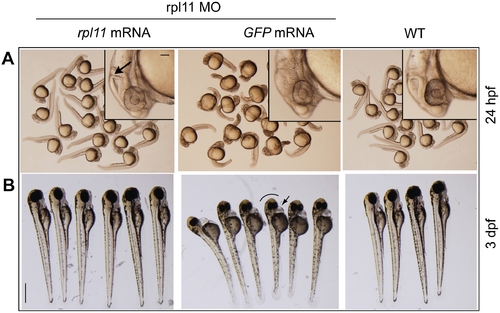
Morphological defects in L11-deficient embryos are rescued by rpl11 mRNA. (A) Morphology of L11-deficient embryos (24 hpf) coinjected separately with rpl11 mRNA and GFP mRNA. rpl11 mRNA (25 ng/µl) coinjected with rpl11 MO (0.5 μg/μl) completely recovers the body length in 24 hpf embryos, but GFP mRNA does not produce any recovery. Insets show the rescue of brain parts such as midbrain-hindbrain boundary (arrow) in the embryos coinjected with rpl11mRNA, but not in GFP mRNA–coinjected embryos. (B) Morphological observation of the rpl11 mRNA and GFP mRNA–coinjected embryos at 3 dpf. The rpl11 mRNA–coinjected embryos have proper head and eye phenotypes, similar to those of the wild-type embryos, whereas GFP mRNA-coinjected embryos display smaller heads and eyes (black curved line) and pericardial edema (arrow). Scale bars: A, inset, 100 μm; B, 500 μm. |
|
The L11-deficient embryos exhibit reduced abundance of neuronal progenitor cells and aberrant expression of transcription factors. (A) Expression of otx2 at 24 hpf. The morphants show a reduction in total abundance of otx2, but its pattern of expression is same as that of wild-type embryos. The inset shows the dorsal view of the midbrain region. (B) krox20 expression at the hindbrain in 24 hpf embryos. The morphants show a proper hindbrain patterning compared to the wild-type embryos. (C) Expression of shh in morphants and wild-type embryos at 24 hpf. The morphants show a marginal reduction in the forebrain midbrain boundary (fmb, inset in C), but floor plate (fp) expression is unaffected. (D) Expression of pax6a in morphants and wild-type embryos at 24 hpf. The morphants show a reduction in total abundance of pax6a, but its pattern of expression is same as that of wild-type embryos (E) The morphants show an increased level of pax2 expression compared to wild-type embryos. The midbrain hindbrain boundary (mhb) expression of pax2 is short and wide in the morphants. pax2 expression at the optic stalk and the otic capsules is also increased in the morphants. All images are in lateral views with anterior to the left. Scale bar: 250 μm. hb, hindbrain; dd; dorsal diencephalon; t, telencephalon; r3, rhombomere 3; r5, rhombomere 5; fmb, forebrain-midbrain boundary; os, optic stalk; mhb, midbrain-hindbrain boundary; oc, otic capsule; sn, spinal chord neurons. EXPRESSION / LABELING:
|
|
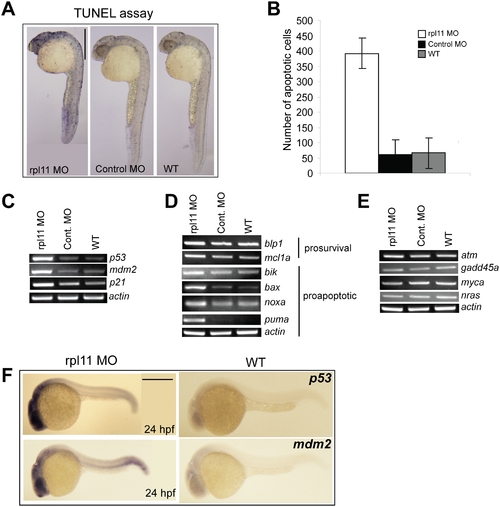
L11 deficiency results in increased cellular apoptosis mediated by p53. (A) TUNEL staining at 24 hpf. The morphants show massive apoptosis (blue dots indicate the TUNEL-positive cells) concentrated primarily in the head region compared to a few scattered positive cells in control and wild-type embryos. (B) Histogram showing the number of apoptotic cells in the head region. Values represent the mean of total number of apoptotic cells counted in the head region of three embryos each for the morphant, control, and wild-type embryos. (C-E) Semi-quantitative RT-PCR of p53, p53-target genes, Bcl-2 family genes, atm, gadd45a, myca, and nras transcript levels relative to actin in the morphant, control, and wild-type embryos at 24 hpf. (F) In situ analysis of p53 and mdm2 at 24 hpf. The morphants show increased expression of p53, exclusively in the head region. mdm2 expression, although more ubiquitous, is also increased in the morphants, particularly in the head region. All images are in lateral views with anterior to the top in A and left in F. Scale bars: A, 500 μm. |
|
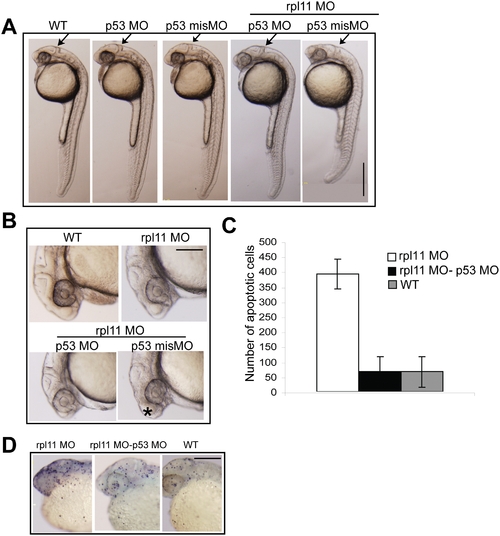
Inactivation of p53 rescues the morphological defects and apoptosis in L11-deficient embryos. (A, B) Morphology of L11-deficient embryos coinjected with either p53 MO or p53 misMO compared to the control embryos at 24 hpf. The overall body length, midbrain-hindbrain boundary (arrow in A), and enlarged forebrain (asterisk in B) are rescued in p53 MO, but not in p53 misMO-injected L11-deficient embryos. (C, D) TUNEL staining of p53 MO injected L11-deficient embryos. The numbers of apoptotic cells (TUNEL-positive cells in D) are reduced, almost similar to those in wild-type embryos, in p53 MO-coinjected embryos compared to rpl11 MO alone–injected embryos. All images are in lateral views with the anterior to the top in A and D and to the left in B. Scale bars: A, 500 μm; B and D, 200 μm. PHENOTYPE:
|
|
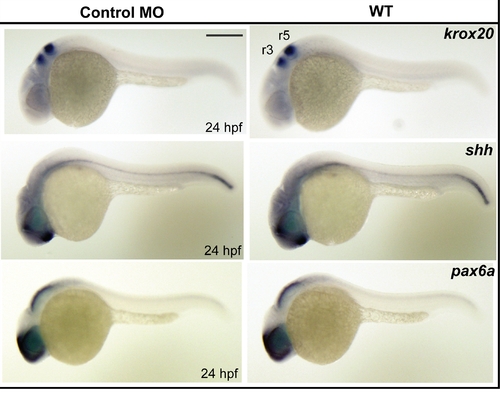
Whole mount in situ hybridization of neural markers in control MO-injected and wild type embryos.The expression level and pattern of krox20, shh, and pax6a in control MO- injected embryos is exactly similar to wild-type embryos at 24 hpf. All images are in lateral views with anterior to the left. Scale bar: 250 μm |
|
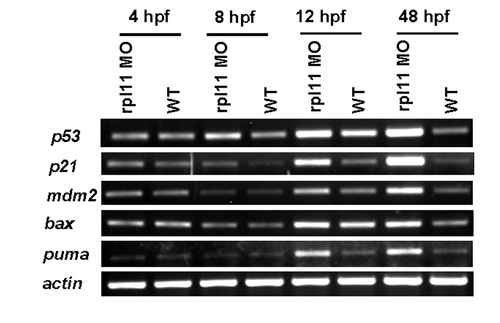
Time-course expression analysis of p53 and its target genes. Semi-quantitative RT-PCR of p53, p53 target genes (p21, mdm2) and apoptotic markers (bax and puma) transcript levels relative to actin in the morphants and wild-type embryos at 4, 8, 12, and 48 hpf. |
|
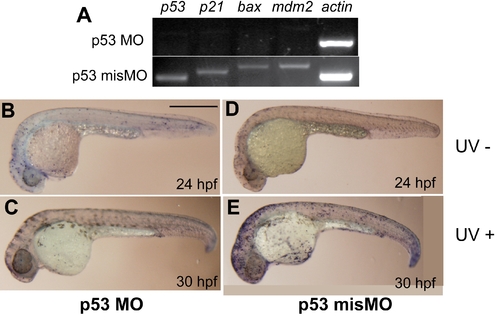
Inhibition of p53 activity and suppression of apoptosis by p53 MO. Zebrafish embryos at the one-cell stage were injected with p53 MO and p53 misMO at 50 pg/embryo. At 24 hpf, the embryos were exposed to 400 mJ/cm UV light for 5 s. Six hours later, they were fixed for TUNEL staining and RT-PCR. (A) Semiquantitative RT-PCR of p53-target genes in UV-exposed embryos injected with p53 MO (50 pg/embryo) or p53 misMO (50 pg/embryo). The p53 response genes are completely downregulated in p53 MO-injected, but not in p53 misMO-injected, embryos. (B–E) TUNEL staining of p53 MO- and p53 misMO-injected embryos before and after UV exposure. The embryos injected with p53 MO show a complete inhibition of apoptosis (indicated by an absence of TUNEL-positive cells) after UV exposure, whereas p53 misMO-injected embryos show extensive apoptosis. All images are in lateral view with anterior to the left. Scale bar: 500 μm. |
|
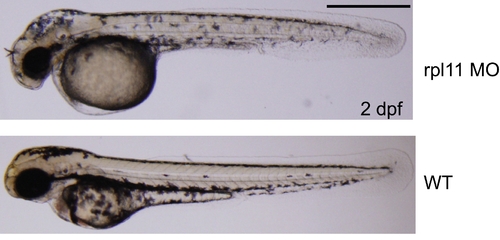
Phenotype of L11morphants at 2 day post fertilization (dpf). Morphology of L11 morphants (upper panel) shows slightly smaller head and eyes, round grey yolk with thin extension, identical to that observed in L11 mutant (rpl11hi3820btg). Lower panel is the wild-type embryo at day 2 dpf. All images are in lateral views with anterior to the left. Scale bar: 1mm PHENOTYPE:
|
|
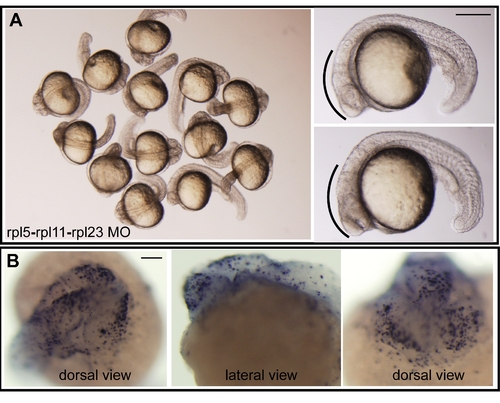
Morphological observation and TUNEL staining of embryos injected simultaneously with rpl5, rpl11, and rpl23 MOs.(A) Lateral views of 24 hpf embryos simultaneously injected with the three MOs. Severe morphological deformities with almost a complete absence of brain subdivisions (black arc) were observed in the morphants. (B) Dorsal and lateral views of the head region of 24 hpf embryos showing extensive apoptosis (blue dots). Scale bars: A, 250 μm; B, 100 μm. PHENOTYPE:
|

