
IMAGE
Fig. S2
- ID
- ZDB-IMAGE-090113-96
- Genes
- Publication
- Chakraborty et al., 2009 - Loss of ribosomal protein L11 affects zebrafish embryonic development through a p53-dependent apoptotic response
- All Figures
- Figures for Chakraborty et al., 2009
Image
|
Figure Caption
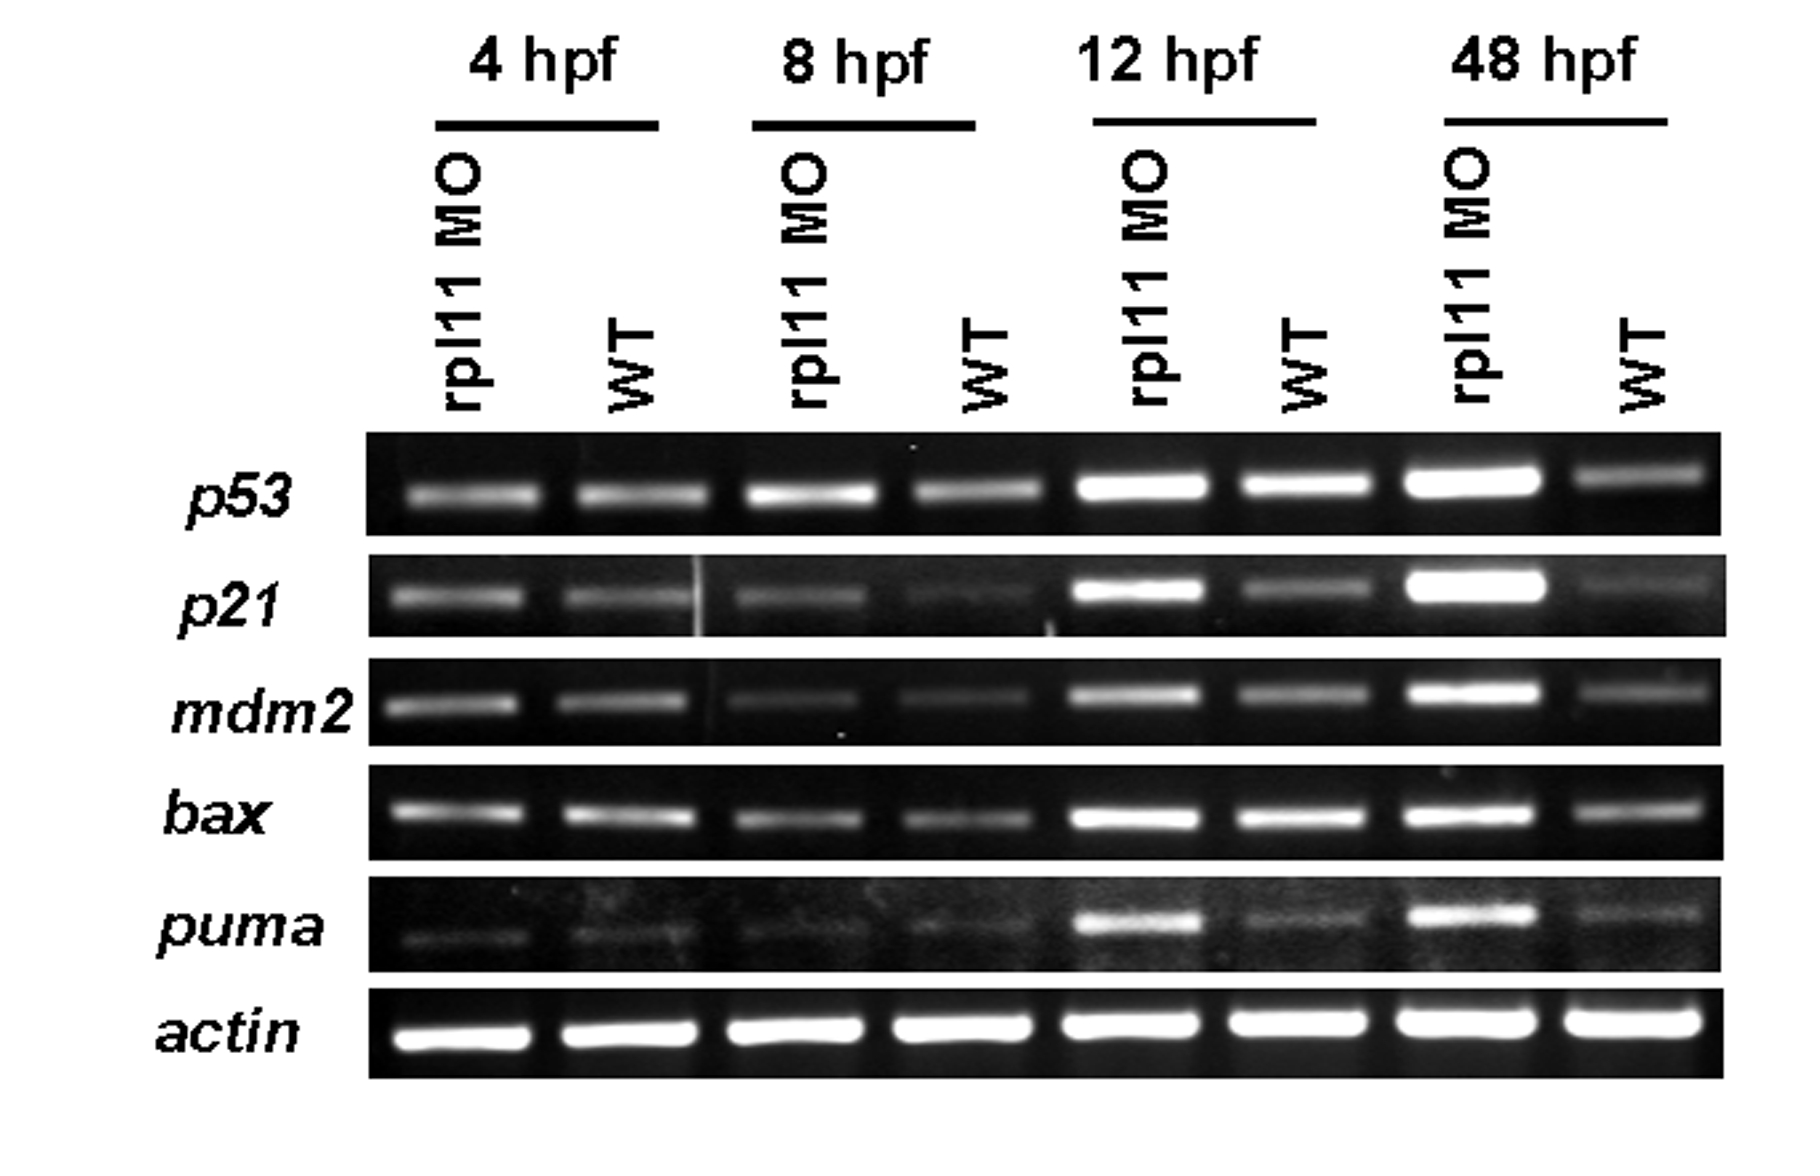
Fig. S2 Time-course expression analysis of p53 and its target genes. Semi-quantitative RT-PCR of p53, p53 target genes (p21, mdm2) and apoptotic markers (bax and puma) transcript levels relative to actin in the morphants and wild-type embryos at 4, 8, 12, and 48 hpf.
Figure Data
Acknowledgments
This image is the copyrighted work of the attributed author or publisher, and
ZFIN has permission only to display this image to its users.
Additional permissions should be obtained from the applicable author or publisher of the image.
Full text @ PLoS One