
- Title
-
Wnt1 regulates neurogenesis and mediates lateral inhibition of boundary cell specification in the zebrafish hindbrain
- Authors
- Amoyel, M., Cheng, Y.C., Jiang, Y.J., and Wilkinson, D.G.
- Source
- Full text @ Development
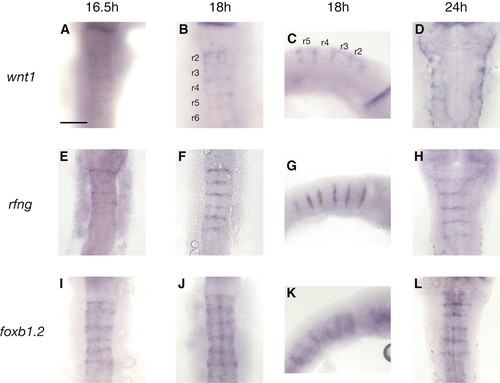
Expression of wnt1 and other markers at hindbrain boundaries. wnt1 (A-D), rfng (E-H) and foxb1.2 (I-L) transcripts are detected in rhombomere (r) boundaries at the indicated stages. Lateral views (C,G,K) reveal that wnt1 expression is restricted to the dorsal half of boundaries at 18 hours. wnt1 transcripts are also detected in the roof plate (A-D). rfng expression is detected only in boundary cells in the hindbrain, whereas foxb1.2 transcripts are also present at lower levels within the rhombomere centres. C, G and K are lateral views, anterior at the right; other panels are dorsal views, anterior at the top. Scale bar: 100 µm EXPRESSION / LABELING:
|
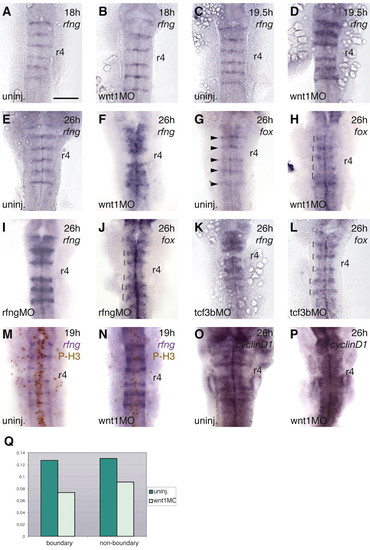
Expansion of boundary marker gene expression domains in Wnt pathway knockdowns. Markers are indicated at the top right of each panel. (A-F) Time-course of the effect of wnt1 morpholino (MO) on rfng expression. No difference between uninjected (uninj) and wnt1 MO embryos is detected at 18 hours (13/14 embryos; A,B), but by 19.5 hours, the rfng expression domain is expanded in wnt1 MO-injected embryos (11/11 embryos; C,D). Expanded rfng and foxb1.2 (fox) boundary expression is detected in wnt1 MO embryos at 26 hours (14/14 embryos; E-H). Arrowheads in G indicate the boundary expression domain of foxb1.2; brackets in H indicate expansion of this domain in wnt1 MO embryos. Ectopic boundary marker expression does not occur in r4. (I-L) Effect of rfng (30/38 embryos; I,J) and tcf3b (48/54 embryos; K,L) knockdown on expression of boundary markers, as indicated. Brackets in J and L indicate the expanded boundary domain of foxb1.2 expression (compare with G). (M-Q) Regulation of cell proliferation by Wnt1. (M,N) Double labelling with rfng (blue signal) and anti-phosphohistone H3 (brown signal) in uninjected and wnt1 MO-injected embryos at 19 hours. (O,P) cyclinD1 is expressed at high levels in hindbrain boundaries at 24 hours in uninjected embryos but not in wnt1 MO-injected embryos. (Q) Graph of mitotic index in boundary cells (rfng expressing) and non-boundary cells in uninjected and wnt1 MO 19-hour embryos. This was calculated by counting the total number of cells and the number of mitotic cells in the hindbrain of uninjected (n=14 embryos) and wnt1 MO-injected embryos (n=24). The total cell number in the hindbrain of wnt1 MO embryos is 84% of that of uninjected embryos. In wnt1 MO embryos the mitotic index was decreased by 42% in boundary regions and 30% in non-boundary regions. Scale bar: 100 µm EXPRESSION / LABELING:
|
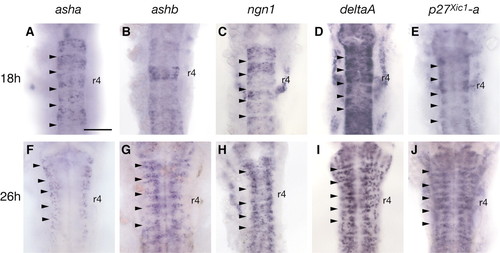
Patterns of neurogenesis in the zebrafish hindbrain. Expression of asha (A,F), ashb (B,G), ngn1 (C,H), deltaA (D,I) and p27xic1-a (E,J) at 18 hours (A-E) and 26 hours (F-J). At both these stages expression is excluded from boundaries (arrowheads). At 18 hours, transcripts for these genes are detected in all segments; ashb is detected at high levels in r4 (B). At 26 hours, stripes of proneural, deltaA and p27xic1-a gene expression occur adjacent to hindbrain boundaries (asha is expressed in stripes adjacent to boundaries by 30 hours). deltaD transcripts (not shown) have a similar distribution to those of deltaA (D,I). Scale bar: 100 µm EXPRESSION / LABELING:
|
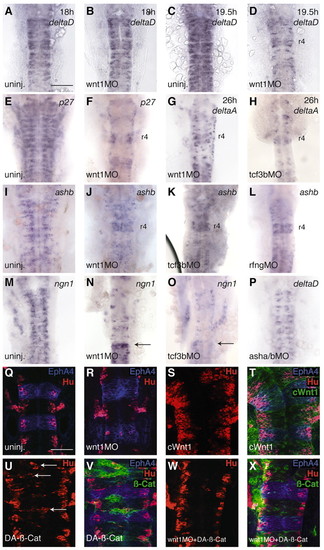
Regulation of neurogenesis in the hindbrain by Wnt signalling. In situ hybridisation or immunocytochemistry was carried out to detect expression of probe/antigen, as indicated at the top right of each panel. (A-D) Time-course of the effect of wnt1 knockdown on deltaD expression; no effect is observed at 18 hours, whereas expression is much reduced at 19.5 hours (8/10 embryos). (E,F) Neurogenesis is reduced in wnt1 MO-injected embryos at 24 hours, as seen by detecting p27xic1-a (p27) expression (20/20 embryos). (G-P) Knockdown of wnt1 (82/86 embryos), tcf3b (50/55 embryos) and rfng (28/37 embryos) all cause downregulation of delta and proneural gene expression at 24 hours. A greater decrease in deltaA expression occurs following knockdown of tcf3b than wnt1 (compare G and H). Notably, neurogenesis is less affected by these knockdowns in r4 (F-H,J-L,N,O), r7 and the spinal cord (arrows in N and O indicate the r6/r7 boundary). (P) Double asha/ashb knockdown decreases deltaD expression. Note that in knockdowns that disrupt neurogenesis, the hindbrain does not broaden and appears to be at an earlier morphological stage due to decreased cell proliferation and major depletion of the mantle zone of postmitotic neurons. (Q-X) Activating Wnt signalling causes ectopic neurogenesis. Hu expression in uninjected (Q), wnt MO injected (R), cWnt1 injected (S,T), stabilised ß-catenin injected (U,V) or double wnt MO and ß-catenin injected embryos (W,X). In T, V and X, expressing cells are green (co-injection of GFP), and r3 and r5 are blue (EphA4). Embryos overexpressing Wnt1 have more neurons than uninjected embryos (compare Q and S). ß-Catenin can cause ectopic neuronal differentiation in expressing cells in uninjected embryos (arrows in U point to ectopic Hu-positive cells that express ß-catenin in V), and in wnt1 MO embryos (compare left and right sides in W; more neurons are present on the left, where most ß-catenin expressing cells are present, X). Scale bars: in A, 100 µm for A-P; in Q, 50 µm for Q-X EXPRESSION / LABELING:
PHENOTYPE:
|
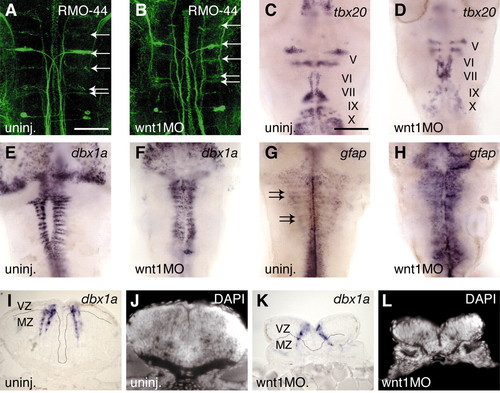
Neurogenesis at 48 hours in wnt MO-injected embryos. (A,B) Reticulospinal neurons labelled by RMO-44 antibody (arrows) are still present (11/14 embryos), and cranial motor nerves (V, VI, VII, IX and X) labelled with tbx20 (C,D) are mildly hypomorphic (11/11 embryos). The number of dbx1a-expressing cells appears to be similar in uninjected and morphant embryos (E,F), but their distribution in stripes adjacent to boundaries is disrupted (20/20 embryos). Sections of uninjected (I,J) and wnt1MO embryos (K,L) show that in uninjected embryos there are many neurons expressing dbx1a in the mantle zone (MZ); in the morphants, most dbx1a expression occurs in the ventricular zone (VZ) of progenitors (4/4 embryos), as determined by DAPI stain (J,L) and by absence of Hu staining (not shown). (G,H) gfap expression occurs in stripes adjacent to boundaries in uninjected embryos (arrows in G), and ectopically in wnt1 MO embryos (H, 12/13 embryos), suggesting that neural progenitors have switched fate to glial cells. Scale bar: in A, 50 µm for A,B,I-L; in C, 100 µm for C-H. |
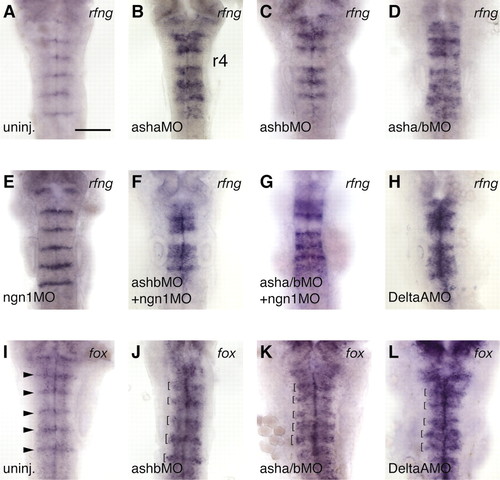
Repression of boundary markers by proneural genes and deltaA. Expression at 24 hours of rfng (A-H) and foxb1.2 (fox, I-L) in uninjected embryos (A,I) and embryos injected with morpholinos to block proneural gene or deltaA function, as indicated (B-H,J-L). The probe is indicated at the top right of each panel. Expansion of rfng and foxb1.2 boundary expression occurs in proneural gene knockdowns (121/145 embryos), and following deltaA knockdown (24/24 embryos). Arrowheads in I indicate boundary expression of foxb1.2, which is broader in MO embryos (brackets, J-L). Different strengths of phenotype are observed following proneural gene knockdown, asha knockdown being the strongest (B) and ngn1 the weakest (E). Ectopic expression is not seen in r4, even in a knockdown of asha, ashb plus ngn1 (G). Scale bar: 100 µm EXPRESSION / LABELING:
|
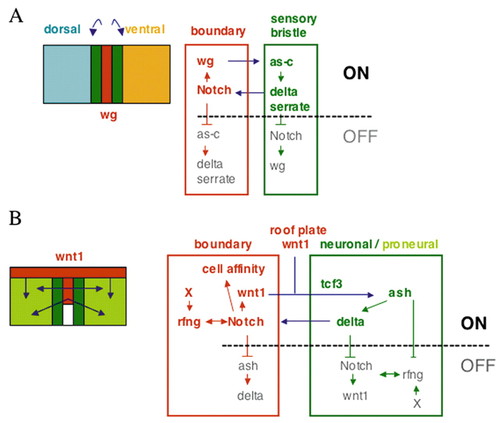
Model of regulation of cell differentiation and restriction of boundary spreading. The diagrams illustrate the similar regulatory hierarchy of gene regulation and intercellular signalling in (A) the anterior compartment of the Drosophila wing disc and (B) the zebrafish hindbrain. In both systems, localised expression of wg/wnt1 is induced by fringe-mediated modulation of Notch activity at boundaries. In the hindbrain, there is in addition fringe-independent expression of Wnt1 in the roof plate. Wg/Wnt1 acts on non-boundary cells to upregulate proneural gene expression (as-c/ash) and thus induce or enable a neural fate. In the wing disc, proneural expression only occurs in neighbouring cells, whereas in the zebrafish hindbrain Wnt1 acts at longer range to promote neurogenesis throughout the segments. Proneural genes upregulate Delta expression, which in turn activates Notch in boundary cells. In addition, proneural gene products and/or Delta cell autonomously suppress boundary cell formation, thus preventing spreading of boundaries. Because in the zebrafish, Notch activation is not sufficient to induce boundary cell marker expression (Cheng et al., 2004), another factor (X) is proposed to be required for boundary cell specification. |