
|
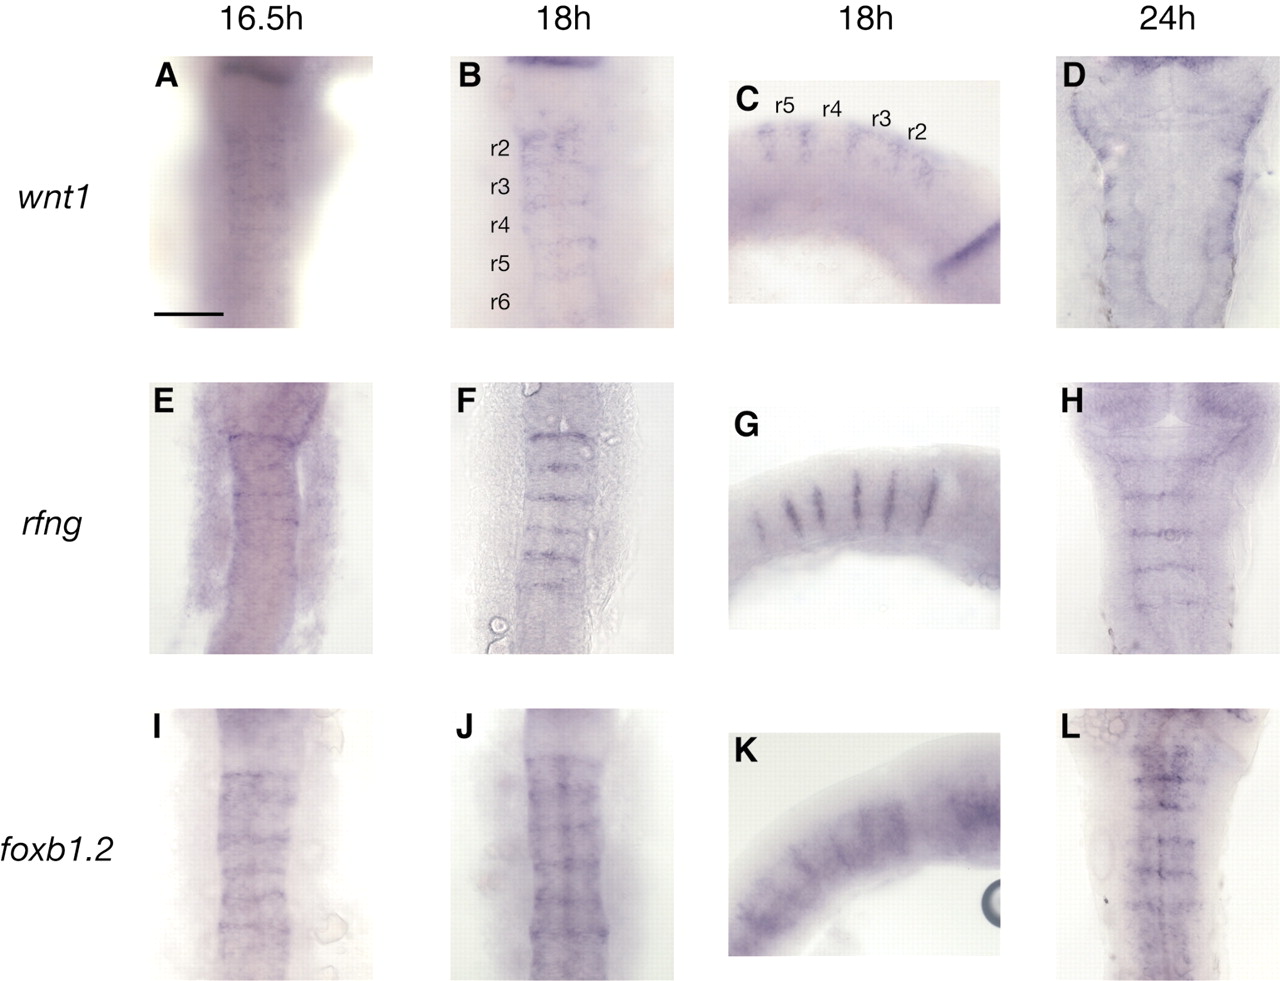
Fig. 1 Expression of wnt1 and other markers at hindbrain boundaries. wnt1 (A-D), rfng (E-H) and foxb1.2 (I-L) transcripts are detected in rhombomere (r) boundaries at the indicated stages. Lateral views (C,G,K) reveal that wnt1 expression is restricted to the dorsal half of boundaries at 18 hours. wnt1 transcripts are also detected in the roof plate (A-D). rfng expression is detected only in boundary cells in the hindbrain, whereas foxb1.2 transcripts are also present at lower levels within the rhombomere centres. C, G and K are lateral views, anterior at the right; other panels are dorsal views, anterior at the top. Scale bar: 100 µm