
- Title
-
MicroRNA-21 Plays Multiple Oncometabolic Roles in Colitis-Associated Carcinoma and Colorectal Cancer via the PI3K/AKT, STAT3, and PDCD4/TNF-α Signaling Pathways in Zebrafish
- Authors
- Lai, C.Y., Yeh, K.Y., Liu, B.F., Chang, T.M., Chang, C.H., Liao, Y.F., Liu, Y.W., Her, G.M.
- Source
- Full text @ Cancers
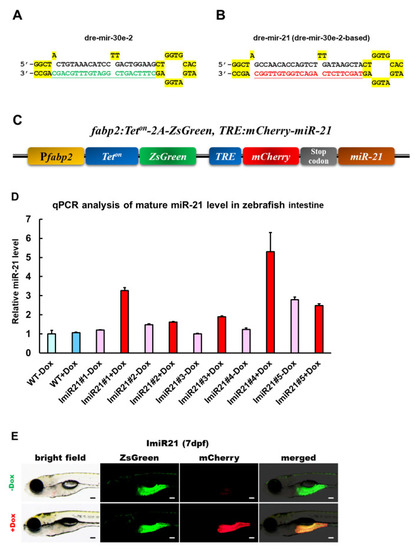
Generation of an intestine-specific and inducible microRNA (miR)-21 transgenic zebrafish. (A) Schematic diagram of the stem-loop structure of dre-mir-30e-2. The mature dre-miR-30e sequence (underlined) can be replaced by other mature miRNA sequences. (B) Schematic diagram of stem-loop structure of dre-mir-30e-2-based dre-mir-21. The mature miRNA region has been replaced by mature dre-mir-21. (C) Schematic diagram of the DNA construct used to generate ImiR-21 [Tg(fabp2a:Teton-2A-ZsGreen, TRE:mCherry-miR-21)]. (D) Relative quantification of miR-21 expression using RT-qPCR analysis. ImiR-21#1–5 + doxycycline (Dox) represents five independent transgenic lines. Control: wild-type (WT)—Dox and ImiR-21#1–5—Dox zebrafish. The expression level of miR-21 was normalized to that of U6 in the intestine of the WT—Dox control. (E) Intestine-specific inducible miR-21 expression in ImiR-21#4 at 7 days post-fertilization (dpf). Transgenic larvae were treated with 25 μg/mL Dox from 3 to 7 dpf. Scale bar: 50 μm. EXPRESSION / LABELING:
|

Identification of the gene markers of intestinal inflammation in zebrafish. (A) Schematic diagram of the dextran sodium sulfate (DSS) treatment strategy. Wild-type (WT) larvae were injected with PBS and 10 ng DSS twice at 14 and 16 days post-fertilization (dpf), and expression of the gene markers of intestinal inflammation was analyzed using RT-qPCR at 21 days post-fertilization (dpf). (B) Survival proportions of injected WT larvae from 0 dpi (days post-injection) to 7 dpi (14 to 21 dpf, p < 0.0001, n = 100 in three independent experiments). The survival rate of DSS-injected WT larvae was approximately 50%. The survival rates were not significantly different between non-injected and PBS-injected WT larvae (>90%). (C,D) RT-qPCR analysis of inflammation-related genes in the intestines of PBS- and DSS-injected WT lines at 21 dpf. mRNA expression levels were normalized to gapdh in the intestine of PBS-injected WT controls. Statistically significant differences from the PBS-injected WT control are denoted by * (p < 0.05), ** (p < 0.01), and *** (p < 0.001) for all panels. EXPRESSION / LABELING:
PHENOTYPE:
|
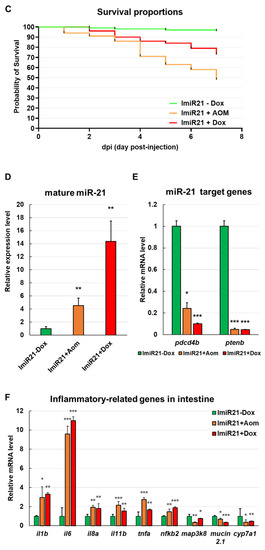
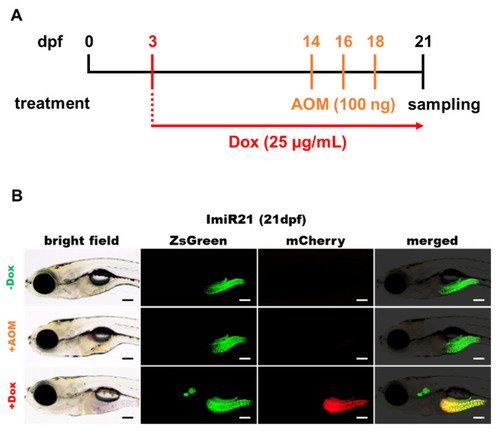
Characterization of expression profiles of inflammation-related genes in ImiR-21 larvae. (A) Schematic diagram of the strategy of doxycycline (Dox) and azoxymethane (AOM) treatment in ImiR-21. ImiR-21 + AOM: ImiR-21 larvae were injected with AOM (100 ng/4.6 nL) at 14, 16, and 18 days post-fertilization (dpf). ImiR-21 + Dox: ImiR-21 larvae were treated with 25 μg/mL Dox from 3 to 21 dpf. Morphology and gene regulatory patterns were analyzed at 21 dpf. (B) Intestinal morphology of ImiR-21 at 21 dpf. ImiR-21 expressed a strong ZsGreen signal in the zebrafish intestine. Upon Dox treatment, the mCherry (and miR-21) signal was induced in the intestine. The intestine was swollen in ImiR-21 + AOM and ImiR-21 + Dox. Scale bar: 200 μm. (C) Survival proportions of ImiR-21 from 14 to 21 dpf (p < 0.0001 n = 100 in 3 independent experiments). (D) RT-qPCR analysis of mature miR-21 level in intestine of ImiR-21 ± Dox and ImiR-21 + AOM at 21 dpf. U6 was used as a reference gene for expression normalization. (E) The mRNA expression level of pdcd4b and ptenb in the intestines of ImiR-21 ± Dox and ImiR-21 + AOM at 21 dpf. (F) The mRNA expression level of inflammation-related genes in the intestine of ImiR-21 ± Dox and ImiR-21 + AOM at 21 dpf. Gene expression levels were normalized to gapdh levels in ImiR-21—Dox for panels (E,F). Statistically significant differences from PBS-injected WT control or ImiR-21—Dox are denoted by * (p < 0.05), ** (p < 0.01), and *** (p < 0.001) for panels (D–F). |
Characterization of expression profiles of inflammation-related genes in ImiR-21 larvae. (A) Schematic diagram of the strategy of doxycycline (Dox) and azoxymethane (AOM) treatment in ImiR-21. ImiR-21 + AOM: ImiR-21 larvae were injected with AOM (100 ng/4.6 nL) at 14, 16, and 18 days post-fertilization (dpf). ImiR-21 + Dox: ImiR-21 larvae were treated with 25 μg/mL Dox from 3 to 21 dpf. Morphology and gene regulatory patterns were analyzed at 21 dpf. (B) Intestinal morphology of ImiR-21 at 21 dpf. ImiR-21 expressed a strong ZsGreen signal in the zebrafish intestine. Upon Dox treatment, the mCherry (and miR-21) signal was induced in the intestine. The intestine was swollen in ImiR-21 + AOM and ImiR-21 + Dox. Scale bar: 200 μm. (C) Survival proportions of ImiR-21 from 14 to 21 dpf (p < 0.0001 n = 100 in 3 independent experiments). (D) RT-qPCR analysis of mature miR-21 level in intestine of ImiR-21 ± Dox and ImiR-21 + AOM at 21 dpf. U6 was used as a reference gene for expression normalization. (E) The mRNA expression level of pdcd4b and ptenb in the intestines of ImiR-21 ± Dox and ImiR-21 + AOM at 21 dpf. (F) The mRNA expression level of inflammation-related genes in the intestine of ImiR-21 ± Dox and ImiR-21 + AOM at 21 dpf. Gene expression levels were normalized to gapdh levels in ImiR-21—Dox for panels (E,F). Statistically significant differences from PBS-injected WT control or ImiR-21—Dox are denoted by * (p < 0.05), ** (p < 0.01), and *** (p < 0.001) for panels (D–F). EXPRESSION / LABELING:
PHENOTYPE:
|
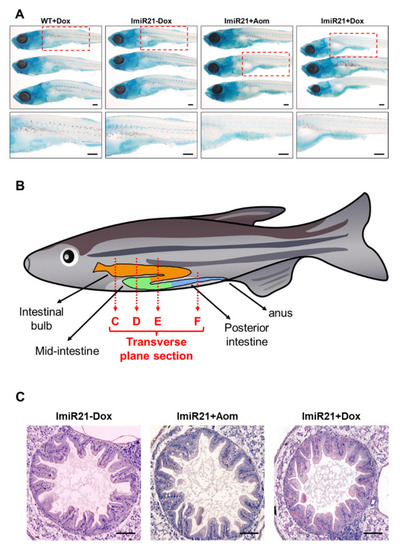
Characterization of inflammatory bowel disease (IBD)-like phenotype in ImiR-21. (A) Representative images of whole-mount alcian blue staining of WT + Dox, ImiR-21 ± Dox, and ImiR-21 + AOM at 21 days post-fertilization (dpf). Blue signals are the stained goblet cells in the injured villus of the posterior intestine of ImiR-21 + AOM and ImiR-21 + Dox animals under inflammatory conditions. Scale bar: 200 μm. (B) Schematic diagram of the intestinal structure of zebrafish. H&E-stained transverse plane sections in different parts of ImiR-21 ± Dox and ImiR-21 + AOM intestines (21 dpf) (intestinal bulb, mid-intestine, and posterior intestine are corresponded to panels (C–F)). Goblet cell hyperplasia is indicated by arrows. Scale bar: 50 μm. |
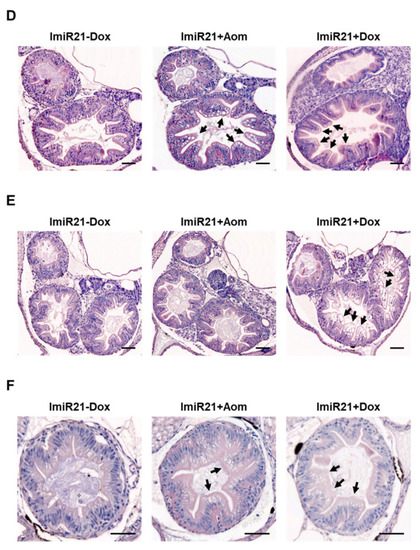
Characterization of inflammatory bowel disease (IBD)-like phenotype in ImiR-21. (A) Representative images of whole-mount alcian blue staining of WT + Dox, ImiR-21 ± Dox, and ImiR-21 + AOM at 21 days post-fertilization (dpf). Blue signals are the stained goblet cells in the injured villus of the posterior intestine of ImiR-21 + AOM and ImiR-21 + Dox animals under inflammatory conditions. Scale bar: 200 μm. (B) Schematic diagram of the intestinal structure of zebrafish. H&E-stained transverse plane sections in different parts of ImiR-21 ± Dox and ImiR-21 + AOM intestines (21 dpf) (intestinal bulb, mid-intestine, and posterior intestine are corresponded to panels (C–F)). Goblet cell hyperplasia is indicated by arrows. Scale bar: 50 μm. PHENOTYPE:
|
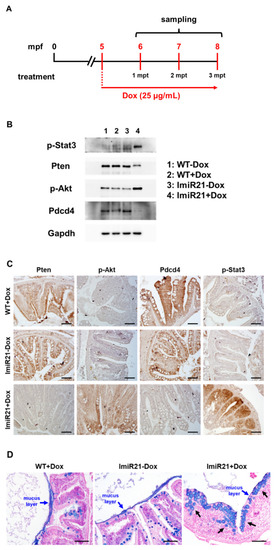
Chronic effects of intestinal miR-21 expression on colitis. (A) Schematic diagram of the Dox treatment strategy in adult ImiR-21. ImiR-21 larvae were treated with 25 μg/mL Dox from 5 to 8 months post-fertilization (mpf). (B) Representative Western blots of the intestinal protein of WT ± Dox and ImiR-21 ± Dox at 6 mpf/1 months post-treatment (mpt). (C) Expression patterns of Ptenb, p-Akt, Pdcd4, and p-Stat3 in 6 mpf/1 mpt WT + Dox and ImiR-21 ± Dox intestine samples after immunohistochemical staining. Scale bar: 50 μm. (D) Representative images of alcian blue-stained intestines of WT + Dox and ImiR-21 ± Dox at 6 mpf/1 mpt. Goblet cell hyperplasia (black arrow) and reduction of mucus layer (blue arrow) were observed in ImiR-21 + Dox intestine. Scale bar: 50 μm. |
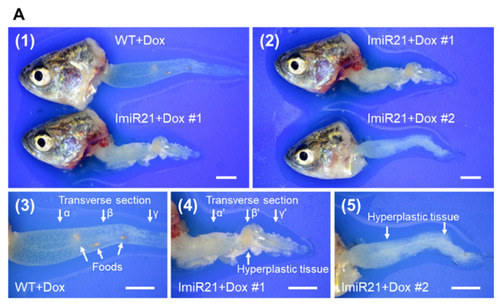
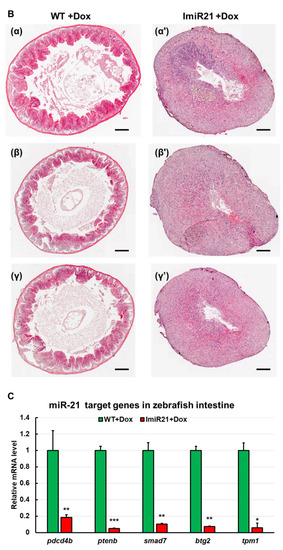
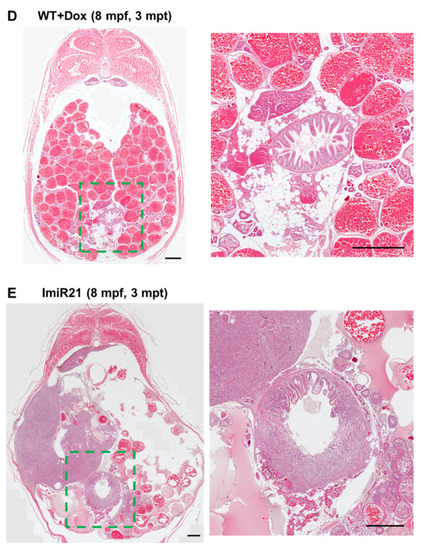
Chronic effects of intestinal miR-21 expression on colitis-associated cancer (CAC). (A) Representative images of gross intestinal phenotypes at 7 months post-fertilization (mpf)/2 months post-treatment (mpt) of WT + Dox and ImiR-21 + Dox. Scale bar: 2 mm. (B) H&E-stained intestinal sections of 7 mpf/2 mpt WT + Dox and ImiR-21 + Dox. (α and α’) Intestinal bulb. (β and β’) Mid-intestine. (γ and γ’) Edge of mid-intestine and posterior intestine. Scale bar: 250 μm. (C) RT-qPCR analysis of the mRNA expression of the CAC-associated genes in the intestine of 7 mpf/2 mpt WT + Dox and ImiR-21 + Dox. Gene expression levels were normalized to gapdh levels in WT + Dox. Statistically significant differences from WT + Dox are denoted by * (p < 0.05), ** (p < 0.01), and *** (p < 0.001). Representative images of H&E-stained sections of (D) WT + Dox and (E) ImiR-21 + Dox at 8 mpf/3 mpt. Scale bar: 2 mm. |
Chronic effects of intestinal miR-21 expression on colitis-associated cancer (CAC). (A) Representative images of gross intestinal phenotypes at 7 months post-fertilization (mpf)/2 months post-treatment (mpt) of WT + Dox and ImiR-21 + Dox. Scale bar: 2 mm. (B) H&E-stained intestinal sections of 7 mpf/2 mpt WT + Dox and ImiR-21 + Dox. (α and α’) Intestinal bulb. (β and β’) Mid-intestine. (γ and γ’) Edge of mid-intestine and posterior intestine. Scale bar: 250 μm. (C) RT-qPCR analysis of the mRNA expression of the CAC-associated genes in the intestine of 7 mpf/2 mpt WT + Dox and ImiR-21 + Dox. Gene expression levels were normalized to gapdh levels in WT + Dox. Statistically significant differences from WT + Dox are denoted by * (p < 0.05), ** (p < 0.01), and *** (p < 0.001). Representative images of H&E-stained sections of (D) WT + Dox and (E) ImiR-21 + Dox at 8 mpf/3 mpt. Scale bar: 2 mm. |
Chronic effects of intestinal miR-21 expression on colitis-associated cancer (CAC). (A) Representative images of gross intestinal phenotypes at 7 months post-fertilization (mpf)/2 months post-treatment (mpt) of WT + Dox and ImiR-21 + Dox. Scale bar: 2 mm. (B) H&E-stained intestinal sections of 7 mpf/2 mpt WT + Dox and ImiR-21 + Dox. (α and α’) Intestinal bulb. (β and β’) Mid-intestine. (γ and γ’) Edge of mid-intestine and posterior intestine. Scale bar: 250 μm. (C) RT-qPCR analysis of the mRNA expression of the CAC-associated genes in the intestine of 7 mpf/2 mpt WT + Dox and ImiR-21 + Dox. Gene expression levels were normalized to gapdh levels in WT + Dox. Statistically significant differences from WT + Dox are denoted by * (p < 0.05), ** (p < 0.01), and *** (p < 0.001). Representative images of H&E-stained sections of (D) WT + Dox and (E) ImiR-21 + Dox at 8 mpf/3 mpt. Scale bar: 2 mm. |

miR-21 Promotes CAC development by activating PI3K/AKT, STAT3, and PDCD4/TNF-α (PSP) signaling networks. Representative images of miR-21-mediated gene regulatory network in CAC/CRC development. miR-21 can induce CRC or colitis-associated cancer (CAC) in ImiR-21 through another PI3K/AKT, PDCD4/TNF-α, and IL-6/STAT3 signaling network, leading to initial inflammation. miR-21 and TNF-α repress PDCD4 and its tumor-suppressive activity; eventually, active STAT3 stimulates a strong inflammatory response and activates the invasion/metastasis process of tumor cells. |